(LosBuntu: Lesson 1)
{ MS12-020 RDP Crash Dump Analysis with Volatility }
| Section 0. Background Information |
- What is the scenario?
- This lesson will show you how to safely conduct a forensics memory investigation on a previous lesson, where we captured Windows 7 Crash Dump file after the MS12-020 RDP exploit was preformed. We will use a LosBuntu Live CD that contains a rich resource of Forensics Investigator toolsets to do the following: (1) Use Sleuthkit tools to determine the file system type of each partition, (2) Safely mount the Windows 7 Data Partition in read-only mode, and (3) Finally, we will use Volatility to analyze the previously captured Windows 7 Memory dump to prove that RDP caused the Windows 7 system to crash.
- What is LosBuntu?
- I wanted to thank my good friend Carlos Cajigas (@carlos_cajigas) for creating LosBuntu and for his generous guidance and mentorship in Cyber Forensics.
- LosBuntu is a Linux Live DVD distribution (distro) that can be used to assist in data forensic investigations. It is a compilation of Master Cajigas' many years of experience as a former law enforcement agent and IBM forensics investigator.
- What is Volatility?
- Volatility supports memory dumps from all major 32-bit and 64-bit Windows versions and service packs including XP, 2003 Server, Vista, Server 2008, Server 2008 R2, Seven, 8, 8.1, Server 2012, and 2012 R2. Whether your memory dump is in raw format, a Microsoft crash dump, hibernation file, or virtual machine snapshot, Volatility is able to work with it. It also supports Linux memory dumps in raw or LiME format and include 35+ plugins for analyzing 32-bit and 64-bit Linux kernels from 2.6.11 - 3.16 and distributions such as Debian, Ubuntu, OpenSuSE, Fedora, CentOS, and Mandrake. It supports 38 versions of Mac OSX memory dumps from 10.5 to 10.9.4 Mavericks, both 32- and 64-bit. Android phones with ARM processors are also supported.
- Reference: http://code.google.com/p/volatility/
- What is the Exploit?
- The Remote Desktop Protocol (RDP) implementation in Microsoft Windows XP SP2 and SP3, Windows Server 2003 SP2, Windows Vista SP2, Windows Server 2008 SP2, R2, and R2 SP1, and Windows 7 Gold and SP1 does not properly process packets in memory, which allows remote attackers to execute arbitrary code by sending crafted RDP packets triggering access to an object that (1) was not properly initialized or (2) is deleted, aka "Remote Desktop Protocol Vulnerability."
- Reference: http://www.cvedetails.com/cve/2012-0002/
- Pre-Requisite Lab
-
Lab Notes
- In this lab we will do the following:
- Download LosBuntu Forensics Live CD
- Boot Windows 7 into LosBuntu
- Display Partitions with fdisk
- Determine File System Type
- Conduct MD5 Check Sum of Windows 7 Data Partition
- Mount Windows 7 Data Partition Read-Only Mode
- Conduction Volatility Memory Analysis
- Un-Mount Windows 7 Data Partition
- Conduct MD5 Check Sum of Windows 7 Data Partition
- In this lab we will do the following:
- Legal Disclaimer
- As a condition of your use of this Web site, you warrant to computersecuritystudent.com that you will not use this Web site for any purpose that is unlawful or that is prohibited by these terms, conditions, and notices.
- In accordance with UCC § 2-316, this product is provided with "no warranties, either express or implied." The information contained is provided "as-is", with "no guarantee of merchantability."
- In addition, this is a teaching website that does not condone malicious behavior of any kind.
- You are on notice, that continuing and/or using this lab outside your "own" test environment is considered malicious and is against the law.
- © 2016 No content replication of any kind is allowed without express written permission.
| Section 1: Download LosBuntu ISO |
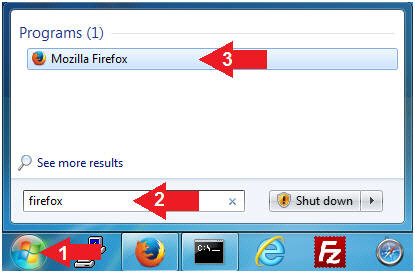
- Open Firefox (Host
Machine)
- Instructions:
- Click the Start Button
- Type firefox in the search box
- Click the firefox icon
- Instructions:
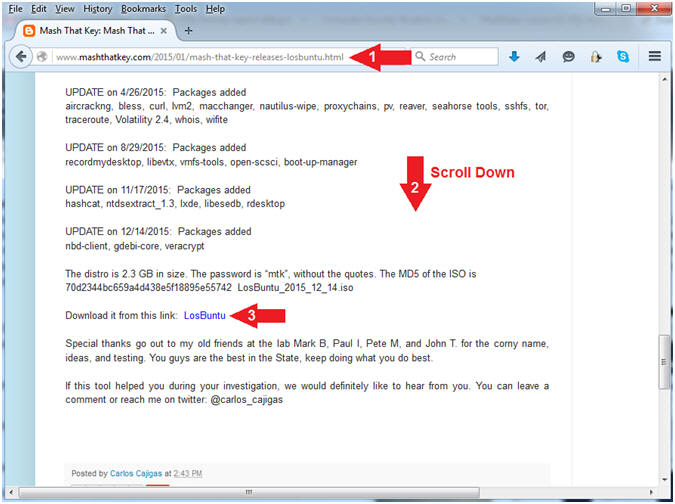
- Start LosBuntu Download (Part 1)
- Instructions:
- Navigate to the following URL
- http://www.mashthatkey.com/2015/01/mash-that-key-releases-losbuntu.html
- Scroll Down until you see the LosBuntu Link
- Click on LosBuntu
- Navigate to the following URL
- Instructions:
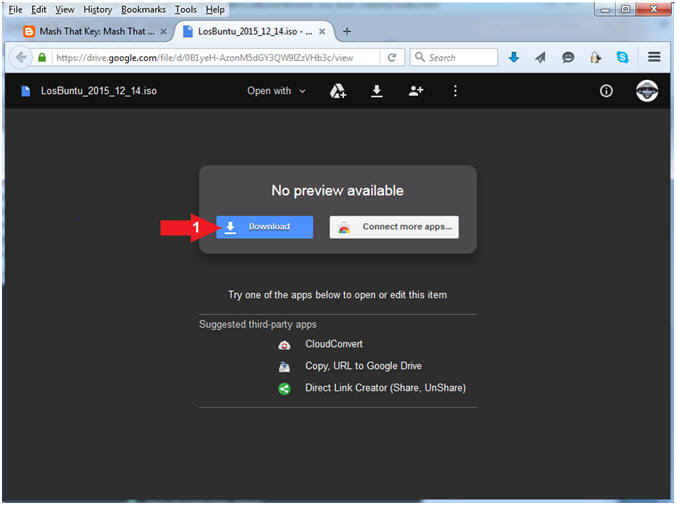
- Start LosBuntu Download (Part 2)
- Instructions:
- Click the Download button
- Instructions:
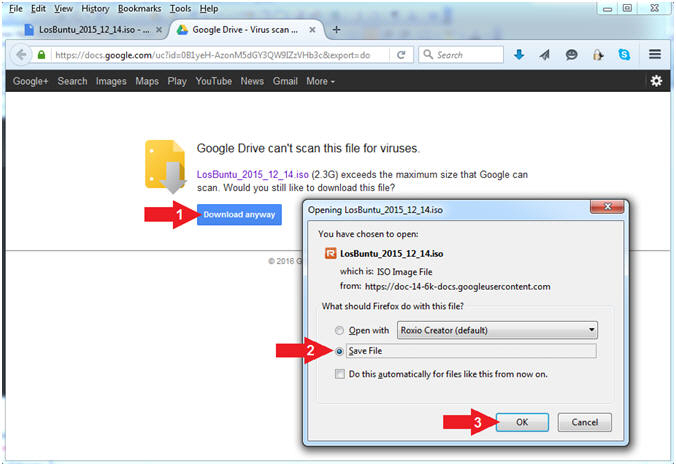
- Start LosBuntu Download (Part 3)
- Instructions:
- Click Download anyway
- Click the Save File radio button
- Click the OK button
- Instructions:
- Save LosBuntu
- Instructions:
- Navigate to your desired destination
directory
- In my case, C:\CSS\ISOs
- File name: LosBuntu_2015_12_14.iso
- Save as type: ISO Image File (*.iso)
- Click the Save button
- Navigate to your desired destination
directory
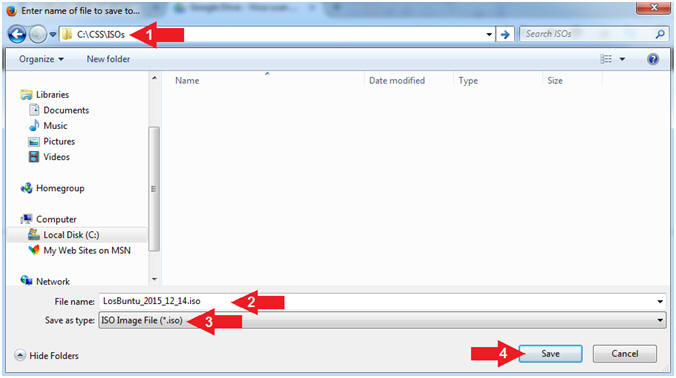
- Instructions:
| Section 2: Start your Windows 7 VM |
- Open VMware Player on your windows machine.
- Instructions:
- Click the Start Button
- Type "vmware player" in the search box
- Click on VMware Player
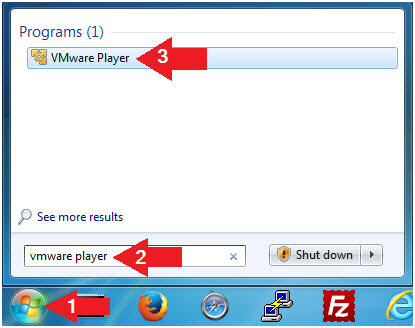
- Instructions:
- Edit Virtual Machine Settings
- Instructions:
- Click on Damn Vulnerable Windows 7
- Click on Edit virtual machine settings
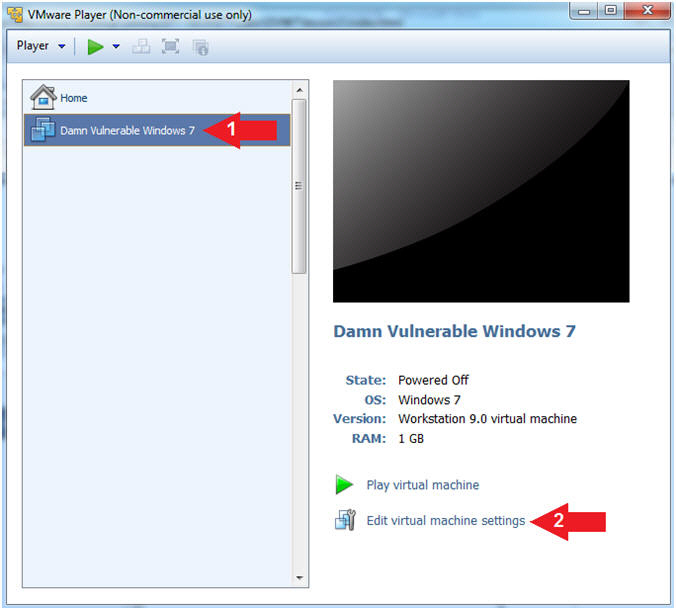
- Instructions:
- Configure Memory
- Instructions:
- Select Memory
- Select on "2048 MB"
- Note(FYI):
- Since, we are going to be analyzing a 512 MB Memory Crash Dump File we need some extra resources. Previously, I was able to only use 1 GB of memory, but the memory analysis took a great deal of time.
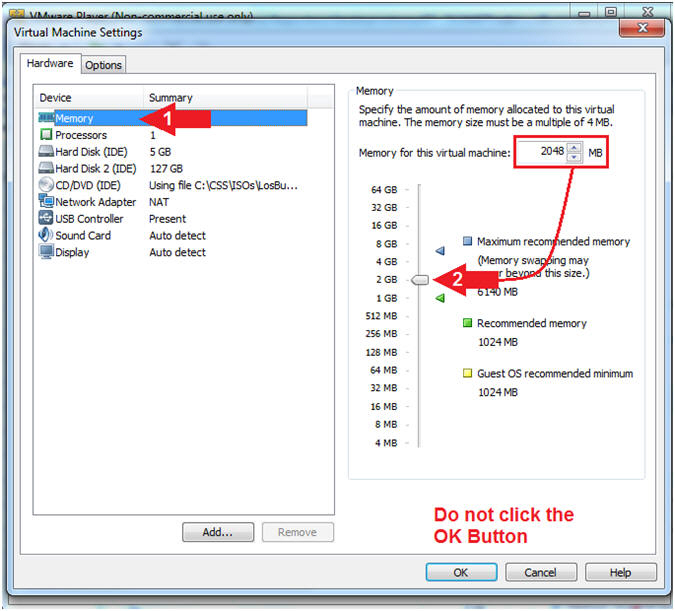
- Instructions:
- Configure CD/DVD Settings
- Instructions:
- Click on CD/DVD(IDE)
- Check Connected
- Select Use ISO image file:
- Click the Browse Button
- Navigate to the
LosBuntu_2015_12_14.iso
- In my case, C:\CSS\ISOs\LosBuntu_2015_12_14.iso
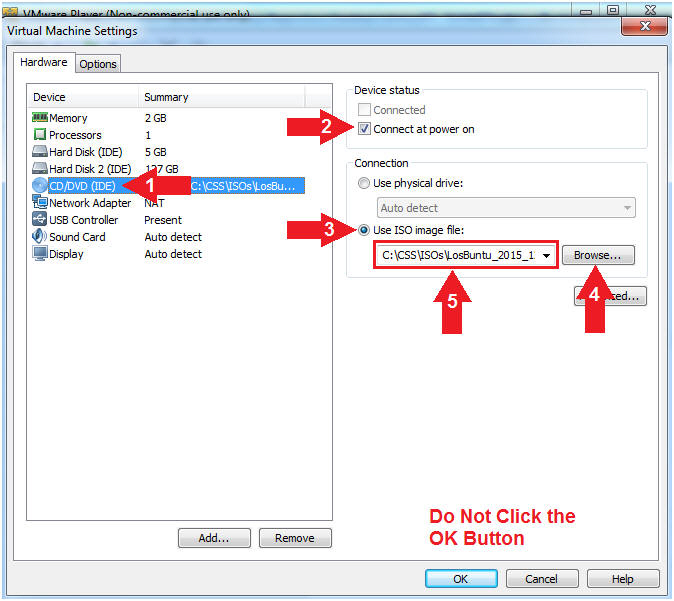
- Instructions:
- Configure Network Adapter
- Instructions:
- Select Network Adapter
- Click the radio button "NAT:
Used to share the host's IP address"
- NAT or Bridged will work. I left it NAT, because that is what it was previously set to for the Damn Vulnerable Windows 7 VM.
- Click the OK button
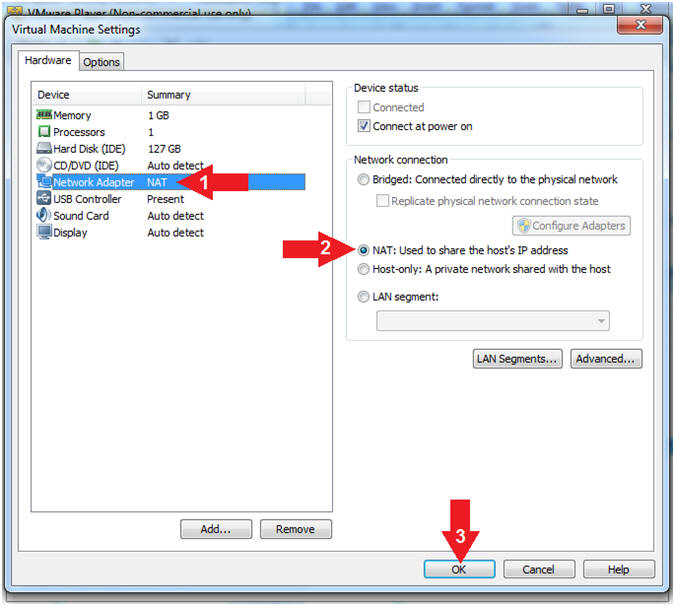
- Instructions:
- Start Damn Vulnerable Windows 7
- Instructions:
- Click on Damn Vulnerable Windows 7
- Click on Play virtual machine
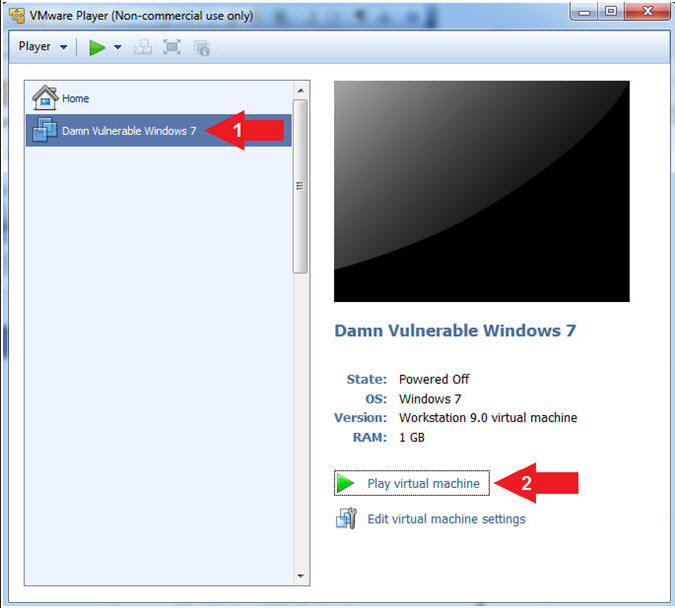
- Instructions:
- Access the Boot Menu
- Instructions
- Left Click in the Black part of the screen once you see the vmware screen.
- Press the <Esc> key
- Note(FYI)
- This might take a few attempts so please do not get frustrated.
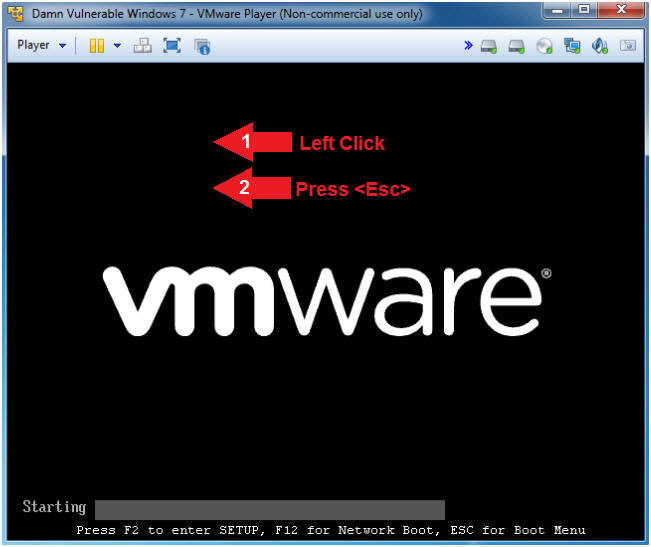
- Instructions
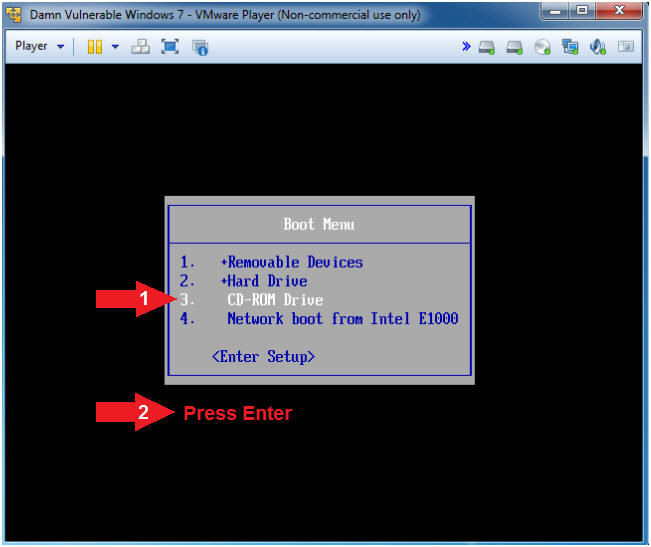
- Boot from CD-ROM Drive
- Instructions
- Arrow Down to where CD-ROM Drive is highlighted
- Press <Enter>
- Instructions
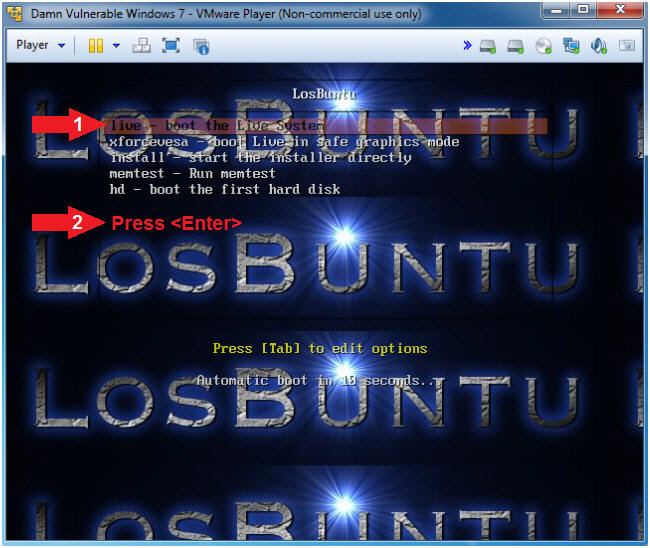
- LosBuntu Boot Menu
- Instructions
- Arrow Down to where live - boot the Live System is highlighted
- Press <Enter>
- Instructions
| Section 3: Login to LosBuntu |
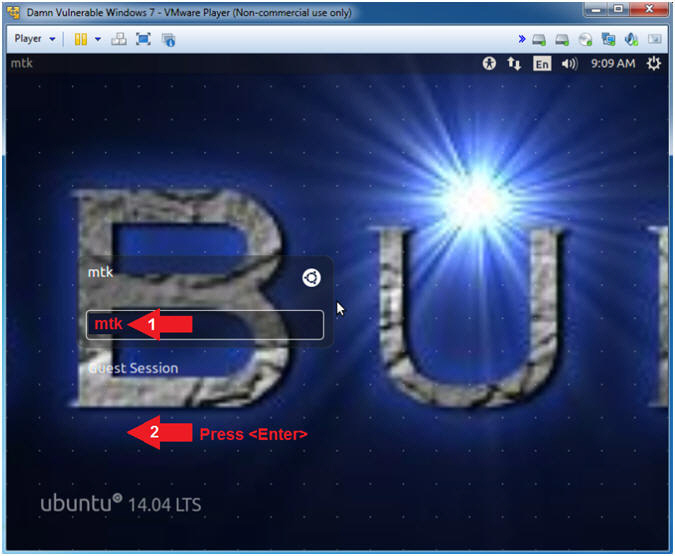
- Login To LosBuntu
- Instructions:
- Password: mtk
- Press <Enter>
- Instructions:
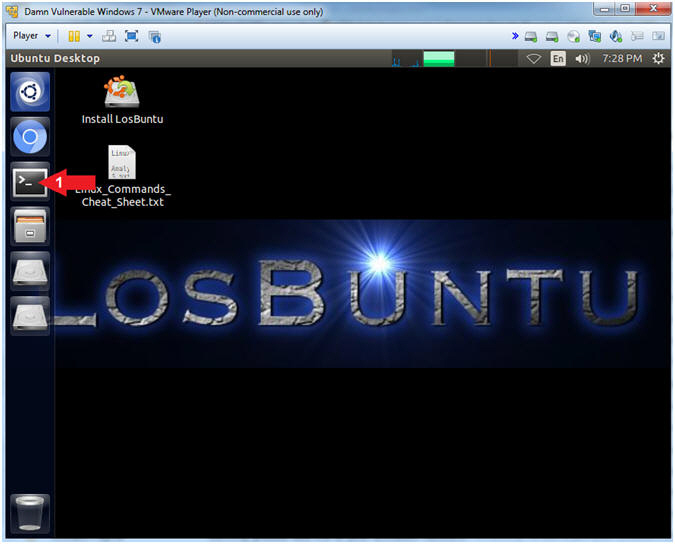
- Open Terminal Window
- Instructions:
- Click on the Terminal Window

- Click on the Terminal Window
- Instructions:
- Terminal Window (Profile Preferences)
- Instructions:
- Edit --> Profile Preferences
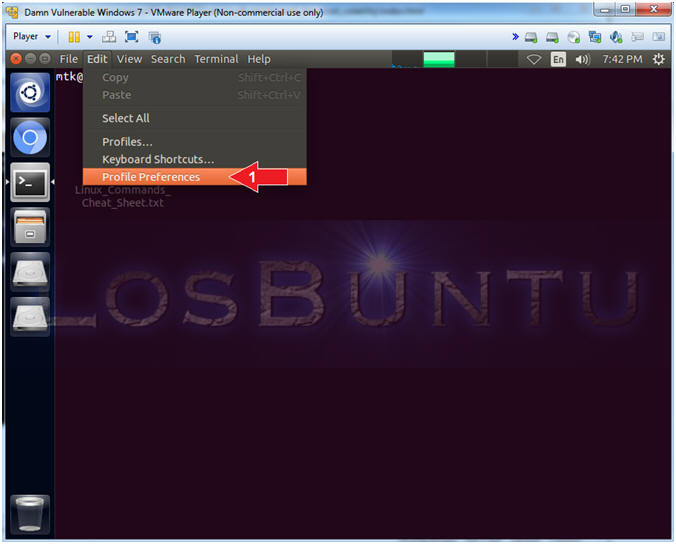
- Instructions:
- Terminal Window (Profile Colors)
- Instructions:
- Click the Colors Tab
- Uncheck Use colors from system theme
- Built-in schemes: Black on white
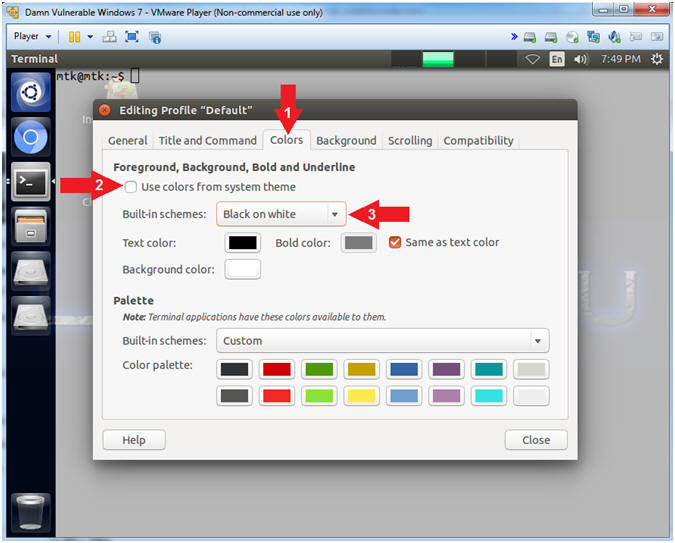
- Instructions:
- Terminal Window (Profile Background)
- Instructions:
- Click the Background Tab
- Shade transparent or image background: Maximum
- Click the Close Button
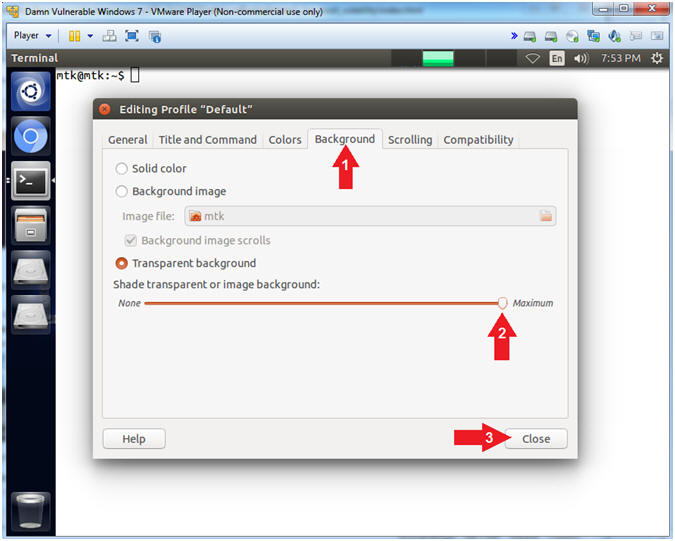
- Instructions:
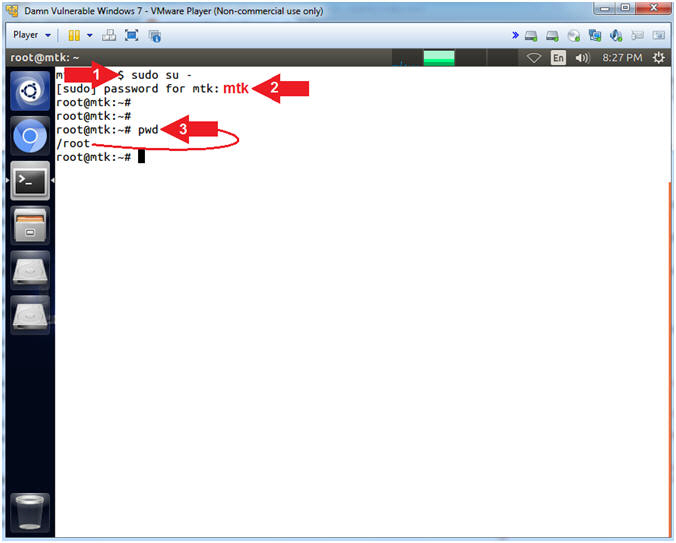
- Become root
- Instructions:
- sudo su -
- password: mtk
- pwd
- Note(FYI):
- Command #1, Use (sudo su -) to similulate an initial root login where the /etc/profile, .profile and .bashrc are executed. Not only will the root user's environment be present, but also the root user will be placed in it's own home directory (/root).
- Command #2, Use (pwd) to display the current working directory of the particular user.
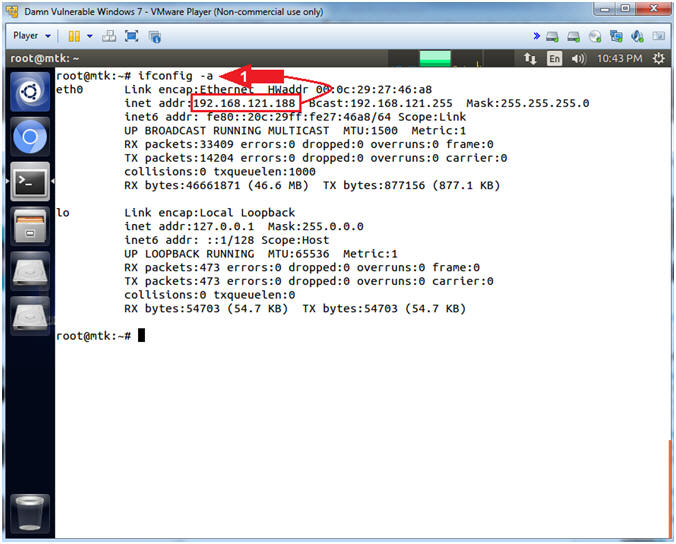
- Instructions:
- Obtain IP Address
- Instructions:
- ifconfig -a
- Note(FYI):
- Command #1, Use (ifconfig -a) to view your IP Address. If the eth0 interface does not have an IP address, then use dhclient to make a DHCP request to obtain an IP address.
- Instructions:
| Section 4: Hard Disk Information |
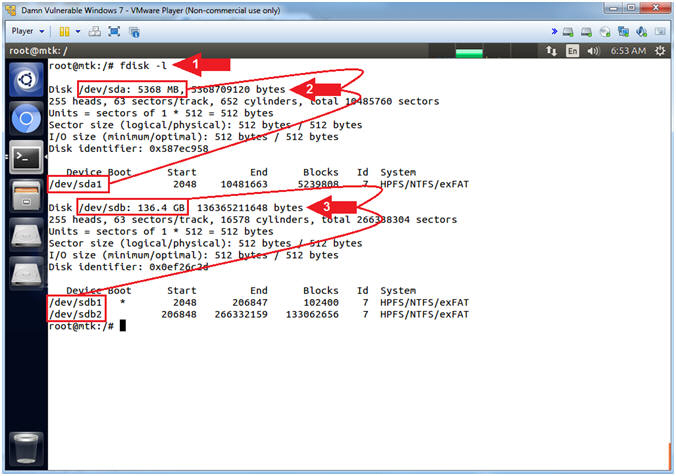
- Using fdisk
- Instructions:
- fdisk -l
- Notice /dev/sda is a 5 GB (5358 MB) Drive. This is the Hard Disk you created in RDP MS12-020 Exploit Lesson, Section 11. This drive only has one partition that is visualized as (/dev/sda1).
- Notice /dev/sdb is a much bigger Drive
(136 GB). The size of your drive will probably be different.
It has two partitions.
- /dev/sdb1 - This is the boot partition which is identified with apostrophe (*) under Boot.
- /dev/sdb2 - This is the partition that holds all the operating system and user data.
- Note(FYI):
- Command #1, Use (fdisk -l) to view both disks (/dev/sda, /dev/sdb) and their partition tables (/dev/sda1, /dev/sdb1 and /dev/sdb2).
- Instructions:
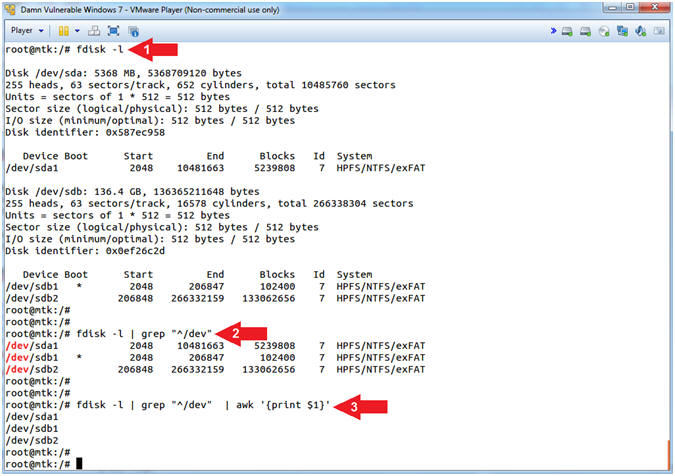
- Using fdisk, grep and awk
- Instructions:
- fdisk -l
- fdisk -l | grep "^/dev"
- fdisk -l | grep "^/dev" | awk '{print $1}'
- Note(FYI):
- Command #1, Use (fdisk -l) to view both disks (/dev/sda, /dev/sdb) and their partition tables (/dev/sda1, /dev/sdb1 and /dev/sdb2).
- Command #2, Use (| grep "^/dev") to only display disk partitions, where we only want to see output that starts with (^) the string (/dev).
- Command #3, Use (awk '{print $1}') to only display the Hard Disk partitions and nothing else. We use (awk) to display the first column of the output, whose default delimiter is white space.
- Instructions:
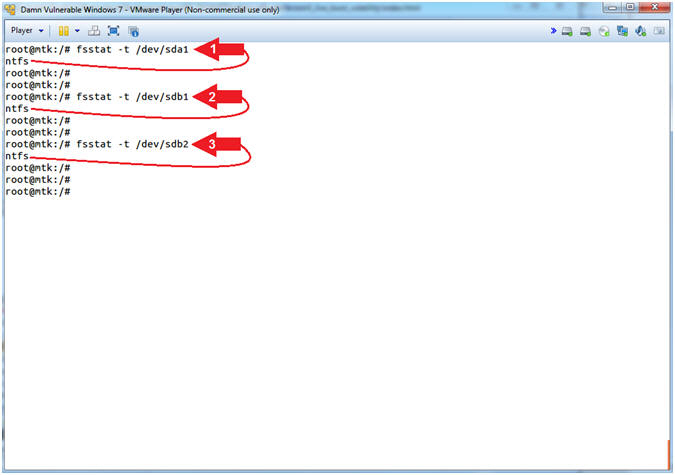
- Using fsstat
- Instructions:
- fsstat -t /dev/sda1
- fsstat -t /dev/sdb1
- fsstat -t /dev/sdb2
- Note(FYI):
- fsstat is part of the Sleuthkit Forensics Suite that displays the details associated with a file system.
- Command #1-3, Use (fsstab -l) to display the file system type of each partition. All partitions are of the NTFS file system type.
- Instructions:
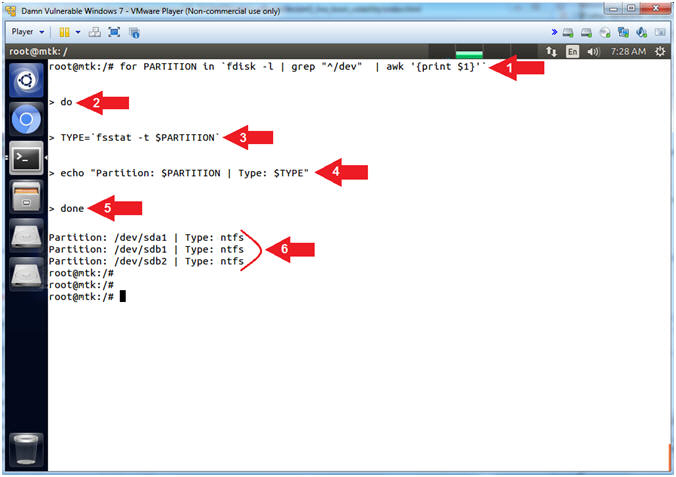
- Using fdisk, grep, awk and fsstat in a For Loop
- Note(FYI):
- The below commands will allow you to write a mini for loop script from command line that will utilize fdisk, grep and awk to only display hard disk partitions. While running through the for loop, fsstab will query each partition for its' file system type.
- Instructions:
- for PARTITION in `fdisk -l | grep "^/dev" | awk '{print $1}'`
- do
- TYPE=`fsstat -t $PARTITION`
- echo "Partition: $PARTITION | Type: $TYPE"
- done
- This is the file system type (ntfs) for each partition (/dev/sda1, /dev/sdb1 and /dev/sdb2).
- Note(FYI):
- Command #1,#2 & #5: Provide the structure of a for loop where (for) is the beginning of the loop; (do) is the start of the body of the loop; and (done) is the end of the loop.
- Command #1, Place the contents of (fdisk -l | grep "^/dev" | awk '{print $1}') is a for loop.
- Command #3: Assign the output of (fsstat -t $PARTITION) to a variable (TYPE).
- Command #4, Use (echo) to print the file system ($TYPE) of each Hard Disk Partition ($PARTITION).
- Note(FYI):
- Mount Forensics Partitions
- Instructions:
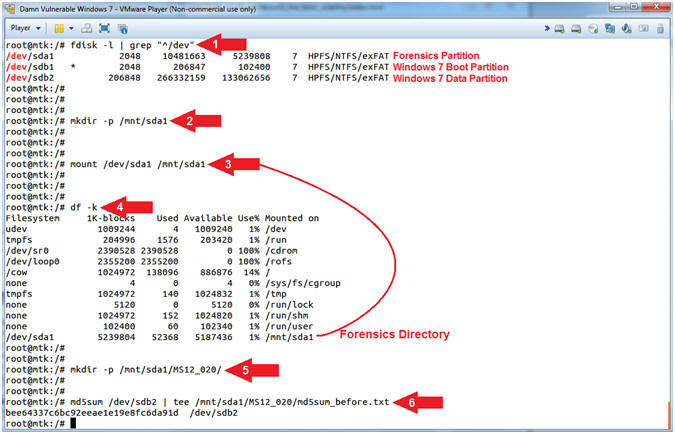
- fdisk -l | grep "^/dev"
- mkdir -p /mnt/sda1
- mount /dev/sda1 /mnt/sda1
- df -k
- mkdir -p /mnt/sda1/MS12_020/
- md5sum /dev/sdb2 | tee /mnt/sda1/MS12_020/md5sum_before.txt
- This will take 15 to 20 minutes.
- Note(FYI):
- Command #1: Display all the Hard Disk partitions. (See Picture).
- Command #2: Use (mkdir) to create the directory (/mnt/sda1). Use the (-p) to suppress errors if the directory already exists.
- Command #3: Use (mount) to mount(ie, access) the Forensics Partition (/dev/sda1) to the previously created directory (/mnt/sda1).
- Command #4: Use (df -k) to display file systems and their disk usage. Notice the last (df -k) entry is (/mnt/sda1). Now you have access to the Forensics Partition.
- Command #5: Use (mkdir) to create the directory (/mnt/sda1/MS12_020/). Use the (-p) to suppress errors if the directory already exists. This is the Forensics Directory that we will store our investigation output.
- Command #6: Use (md5sum) to compute and check MD5 message digest of the Windows 7 Data Partition (/dev/sdb2) before we start the investigation. We will compare the BEFORE checksum with an AFTER checksum to prove the Windows 7 Data Partition (/dev/sdb2) did not change during the investigation.
- Instructions:
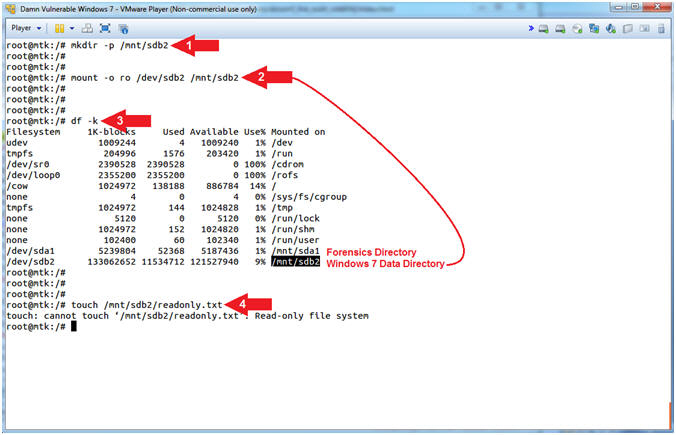
- Mount Windows 7 Data Partitions
- Instructions:
- mkdir -p /mnt/sdb2
- mount -o ro /dev/sdb2 /mnt/sdb2
- df -k
- touch /mnt/sdb2/readonly.txt
- Note(FYI):
- Command #1: Use (mkdir) to create the directory (/mnt/sdb2). Use the (-p) to suppress errors if the directory already exists.
- Command #2: Use (mount) to mount(ie, access) the Windows 7 Data Partition (/dev/sdb2) in read only mode (-o ro) to the previously created directory (/mnt/sdb2).
- Command #3: Use (df -k) to display file systems and their disk usage. Notice the last two (df -k) entries are the Forensics Directory (/mnt/sda1) and the Windows 7 Data Directory (/mnt/sdb2).
- Command #4: Use (touch) to try to create a file (readonly.txt) in the Windows 7 Data Directory (/mnt/sdb2). Notice that we cannot and we get a message saying the file system is Read-only.
- Instructions:
- Copy Over Blue Screen File
- Instructions:
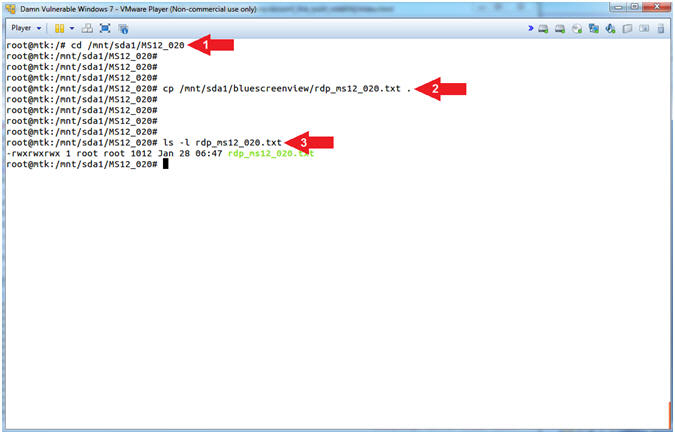
- cd /mnt/sda1/MS12_020
- cp /mnt/sda1/bluescreenview/rdp_ms12_020.txt .
- ls -l rdp_ms12_020.txt
- Note(FYI):
- Command #1: Use (cd) to change directory into (/mnt/sda1/MS12_020).
- Command #2: Use (cp) to copy the file (rdp_ms12_020.txt) from (/mnt/sda1/bluescreenview) into the current directory (/mnt/sda1/MS12_020). The dot(.) at the end of the line means current working directory.
- Command #3: Use (ls) and (-l) to display the details of the file (rdp_ms12_020.txt).
- Instructions:
- Display Blue Screen File
- Instructions:
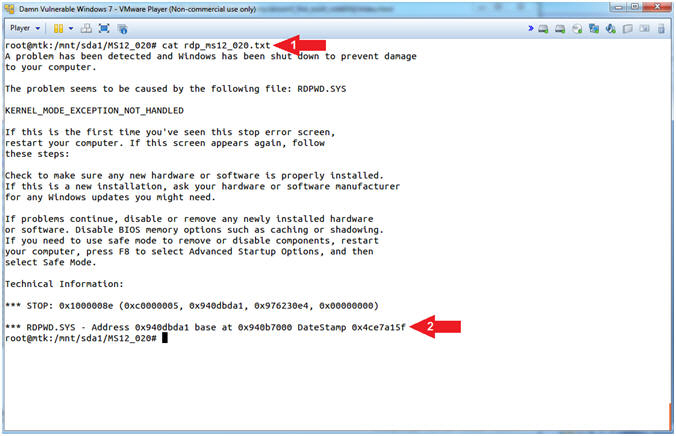
- cat rdp_ms12_020.txt
- We will use the base memory address to link the crash to RDP using Volatility.
- Note(FYI):
- Command #1: Use (cat) to display the contents of the (rdp_ms12_020.txt) file.
- Instructions:
| Section 5: Determine Crash Time with Volatility |
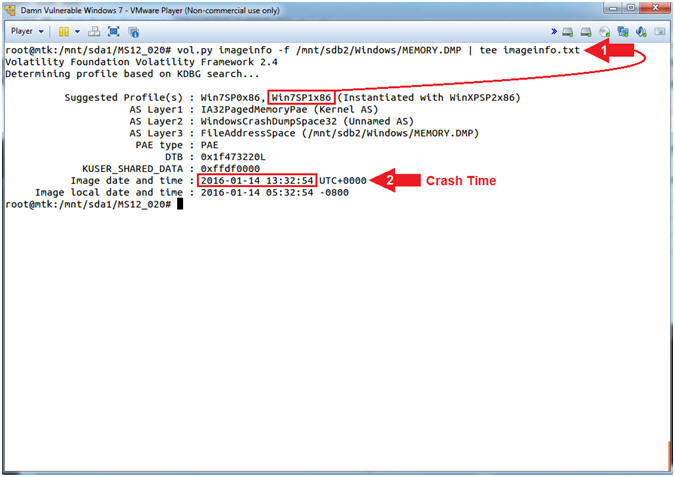
- Determine Which Profile to Use
- Instructions
- vol.py imageinfo -f /mnt/sdb2/Windows/MEMORY.DMP | tee imageinfo.txt
- Image date and time refers to the time of the system crash.
- Note(FYI):
- Command #1, ask Volatility to identify the Operating System Version of the image (MEMORY.DMP).
- Instructions
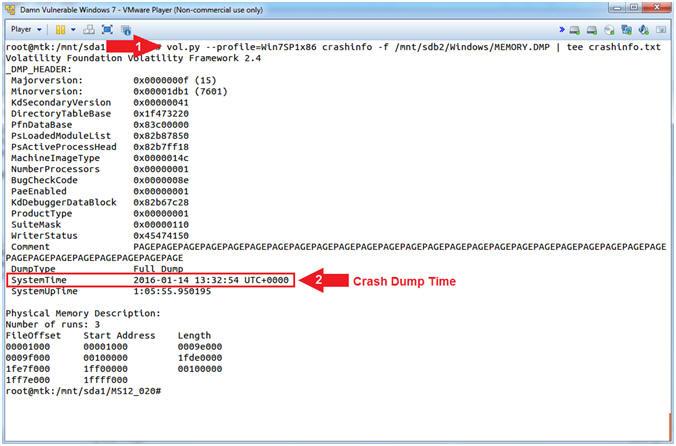
- Display Crash Dump Header
- Instructions
- vol.py --profile=Win7SP1x86 crashinfo -f /mnt/sdb2/Windows/MEMORY.DMP | tee crashinfo.txt
- SystemTime refers to the time of the system crash.
- Note(FYI):
- Command #1, Use (crashinfo) to display the crashdump header. Use (tee) to view the output and create a the file (crashinfo.txt).
- Instructions
| Section 6: Determine Suspect Process IDs with Volatility |
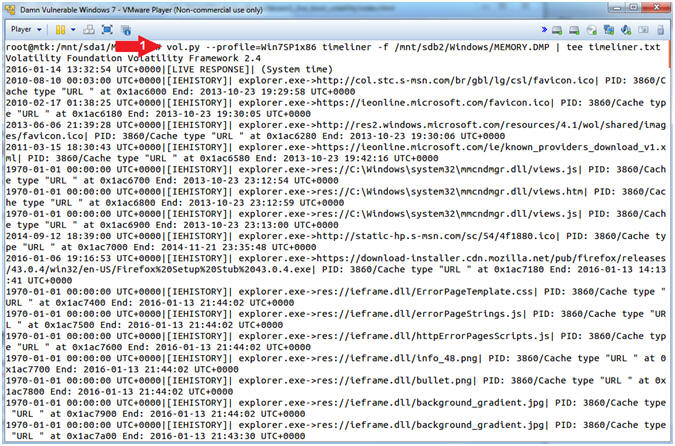
- Display System Timeline
- Instructions
- vol.py --profile=Win7SP1x86 timeliner -f /mnt/sdb2/Windows/MEMORY.DMP | tee timeliner.txt
- Note(FYI):
- Command #1, The (timeliner) plugin creates a timeline crash from various artifacts in memory from the following sources: processes, DLLs, modules, sockets, registry keys and embedded registry data such as UserAssist and AppCompatCache (shimcache).
- Instructions
- Display Crash Time Process IDs
- Instructions
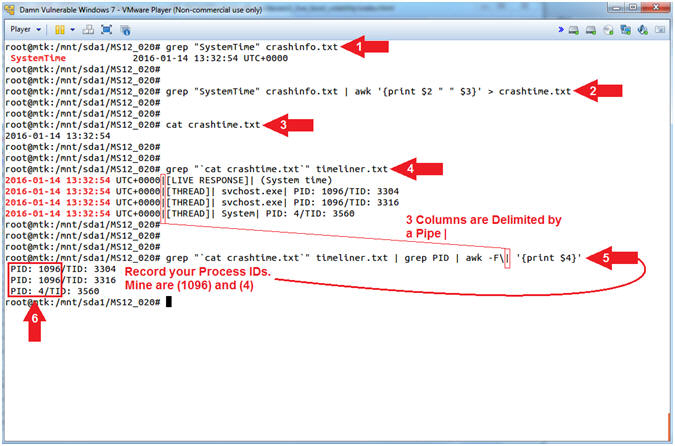
- grep "SystemTime" crashinfo.txt
- grep "SystemTime" crashinfo.txt |
awk '{print $2 "
" $3}' > crashtime.txt
- Where ( ) represents one white space.
- cat crashtime.txt
- grep
"`cat
crashtime.txt`"
timeliner.txt
- Where (") is a double quote.
- Where (`) is a back tick, generally located with the tilde(~) key.
- grep
"`cat
crashtime.txt`"
timeliner.txt | grep PID | awk -F\|
'{print $4}'
- Where (") is a double quote.
- Where (`) is a back tick.
- Where (') is a single quote.
-
Record your Process IDs.
- Mine are 1096 and 4.
- Note(FYI):
- Command #1, Use (grep) to retrieve the line that contains the string (SystemTime) from the crashinfo.txt file.
- Command #2, Use (awk) to cut out
the date_time stamp from the previous grep command, where a white
space is the default delimiter. Thus, (awk
'{print $2 " " $3}')
means to display only $2(2016-01-14) and $3(13:32:54) and separate
the output with a white space.
- $1 $2 $3 $4
- SystemTime 2016-01-14 13:32:54 UTC+0000
- Command #3, Use (cat) to display the contents of the (crashtime.txt) file.
- Command #4, Use (grep) to search
the (timeliner.txt) file for the string contained in the
crashtime.txt file.
- E.g., grep "2016-01-14 13:32:54" timeliner.txt
- Command #5, Is similar to Command #4, but we use (grep) to only display lines that contain the string (PID). Then we use (awk) and the delimiter(|) to cut out and display the forth($4) column.
- Instructions
- Display System Processes
- Instructions
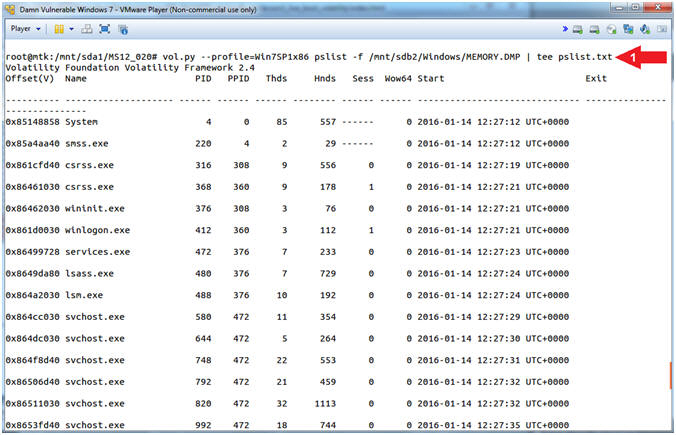
- vol.py --profile=Win7SP1x86 pslist -f /mnt/sdb2/Windows/MEMORY.DMP | tee pslist.txt
- Note(FYI):
- Command #1, The (pslist) plugin lists the processes of a system. Use (tee) to display the (pslist) output and write that output to a file (pslist.txt).
- Instructions
- Interrogating System Processes
- Note(FYI):
- Replace the Process IDs(1096 and 4) with your PIDs obtained from (Section x, Step y).
- Instructions
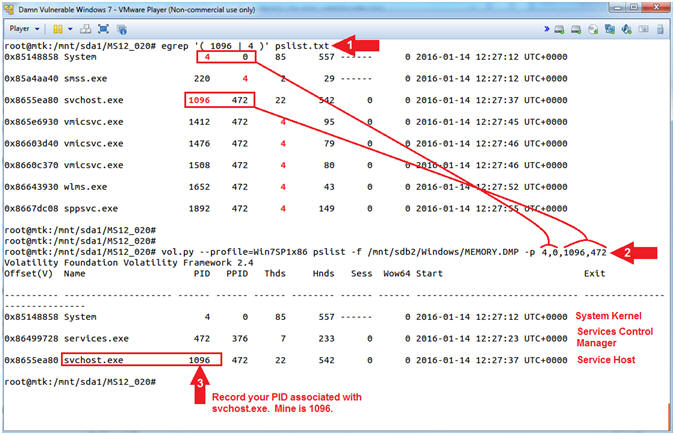
- egrep
'(
1096
|
4
)'
pslist.txt
- Note ( ) is a white space. Note (') is a single quote.
- Record your Process ID and Parent ID for System. Mine are 4 and 0. Yours will probably be different.
- Record your Process ID and Parent ID for svchost.exe. Mine are 1096 and 472. Yours will probably be different.
- vol.py --profile=Win7SP1x86
pslist -f /mnt/sdb2/Windows/MEMORY.DMP
-p 4,0,1096,472
- Replace 4 and 0 with your Process ID and Parent ID for System.
- Replace 1096 and 472 with your Process ID and Parent ID for svchost.exe.
- Record your Process ID associated with svchost.exe. Mine is 1096.
- egrep
'(
1096
|
4
)'
pslist.txt
- Note(FYI):
- Command #1, Use (egrep) to search for PID 1096 or PID 4 in the (pslist.txt) file. It is important to put a white space( ) before and after each PID. Otherwise (egrep) will show every line that contains a 4 or 1096. (E.g., 3824 or 31096)
- Command #2, (pslist) has a flag (-p)
that allows the user to only display specific Process IDs.
(E.g., -p
4,0,1096,472)
- System refers to the Operating System Kernel. Hence, that is why the Parent Process ID is 0.
- services.exe is the Services Control Manager, which is responsible for running, ending, and interacting with system services.
- Svchost.exe is a process on your computer that hosts, or contains, other individual services that Windows uses to perform various functions. Svchost is essential in the implementation of so-called shared service processes, where a number of services can share a process in order to reduce resource consumption.
-
Conclusion:
- At this point, we only know that something was using the shared service (svchost.exe) during the time the system crashed. Our job now is to link the process, daemon, service, library or driver to svchost.exe.
- Note(FYI):
| Section 7: Determine Suspect Network Connections with Volatility |
- Display Network Connection
- Instructions
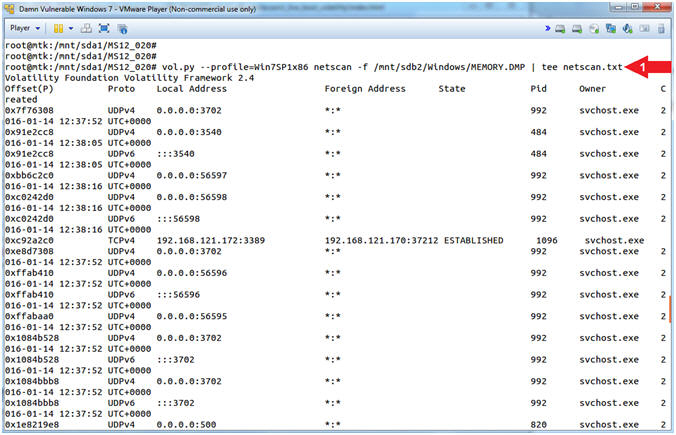
- vol.py --profile=Win7SP1x86 netscan -f /mnt/sdb2/Windows/MEMORY.DMP | tee netscan.txt
- Note(FYI):
- Command #1, The (netscan) plugin lists the following network artifacts: TCP endpoints, TCP listeners, UDP endpoints, and UDP listeners. Use (tee) to display the (netscan) output and write that output to a file (netscan.txt).
- Instructions
- Interrogate Network Connections
- Instructions
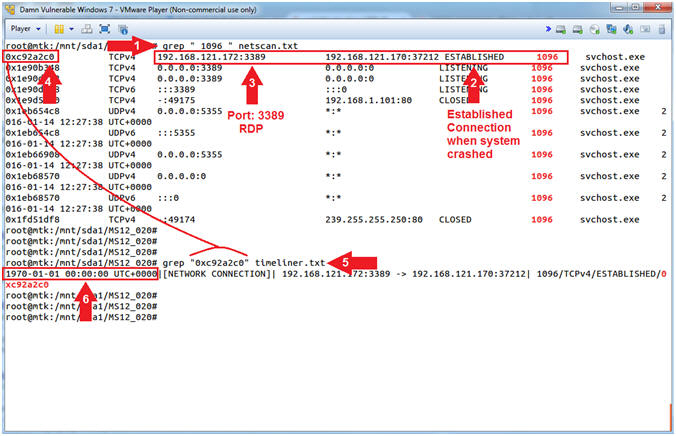
- grep "
1096 "
netscan.txt
- Where the ( ) is a white space.
- Notice the ESTABLISHED svchost.exe connection between two the local(192.168.121.172) and remote (192.168.121.170) IP addresses.
- Notice the ESTABLISHED connection is on TCP Port 3389, which is typically identified with RDP (Remote Desktop Protocol).
- Record the memory address of the ESTABLISHED connection. Mine is (0xc92a2c0).
- grep "0xc92a2c0"
timeliner.txt
- Replace 0xc92a2c0 with the address that you recorded above.
- Although there is an established connection, the timeliner plugin contains a weird timestamp(1970-01-01 00:00:00) for this connection.
- grep "
1096 "
netscan.txt
- Note(FYI):
- Command #1, Use (grep) to search the (netscan.txt) file for the ( 1096 ) process ID string. It is important to put a white space( ) before and after the PID. Otherwise (grep) will show every line that contains 1096. (E.g., 31096)
- Command #6, Since the netscan plugin did not display a time of the connection, I am hoping timeliner might help us.
- However, timeliner says the time of the connection was at 1970-01-01 00:00:00. The time of the event was not recorded due to the system crash, so timeliner assigns it the system's starting epoch time. System time is measured by a system clock, which is typically implemented as a simple count of the number of ticks that have transpired since some arbitrary starting date, called the epoch. For most Unix, Linux and Windows Operating Systems the epoch is 1970-01-01 00:00:00.
-
Conclusion:
- Using the System Crash time, we discovered which Process IDs were running in memory. Here we can clearly see, there was an ESTABLISHED TCP/3389 RDP Connection between a local and remote machine. We use the TCP physical memory address for the RDP connection and find a matching line in the timeliner log. There is no timestamp associated with this RDP connection, because something happened during this established connection. We are one step closer to saying RDP definitely caused the crash.
- Instructions
| Section 8: Correlating Blue Screen Crash Address with Volatility |
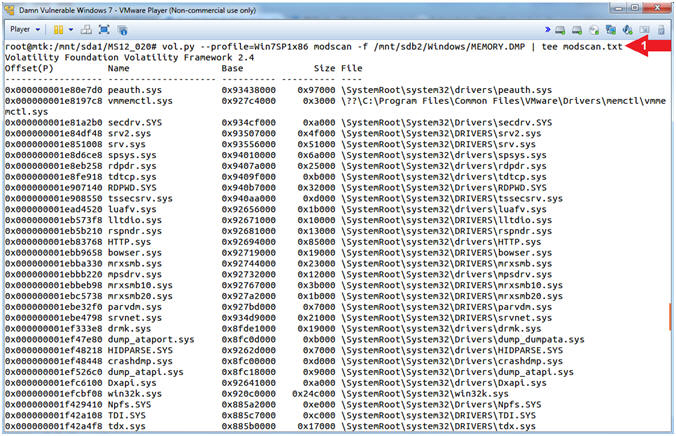
- Display Physical Memory
- Instructions
- vol.py --profile=Win7SP1x86 modscan -f /mnt/sdb2/Windows/MEMORY.DMP | tee modscan.txt
- Note(FYI):
- Command #1, The (modscan) plugin lists physical memory for the kernel modules. (modscan) can pick up previously unloaded drivers and drivers that have been hidden/unlinked by rootkits. Included in the output is the offset of the module, which is a physical address. Use (tee) to display the (modscan) output and write that output to a file (modscan.txt).
- Instructions
- Interrogate Physical Memory
- Instructions
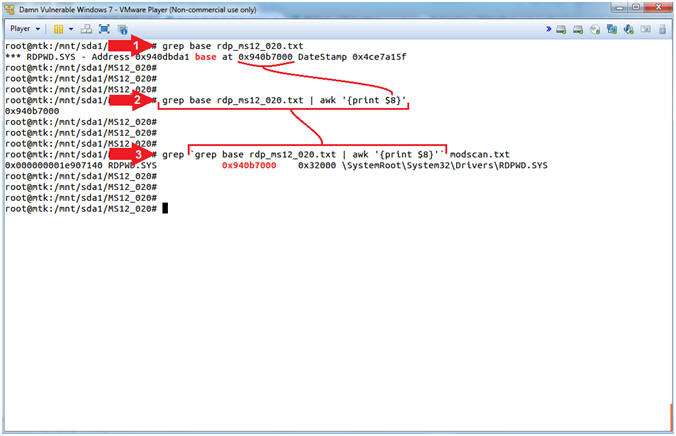
- grep base rdp_ms12_020.txt
- grep base rdp_ms12_020.txt | awk
'{print $8}'
- Where (') is a single quote.
- grep
`grep base
rdp_ms12_020.txt | awk '{print
$8}'`
modscan.txt
- Where (`) is a back tick located on the tilde key(~).
- Where (') is a single quote.
- Note(FYI):
- Command #1, Use (grep) to search the (rdp_ms12_020.txt) file for the string (base). Note the (rdp_ms12_020.txt) file is the Blue Screen output obtained in the previous [Metasploit Lesson 19, Section 14, Step 14].
- Command #2, Adding to Command #1, we will use (awk '{print $8}') to cut out the base RDPWD.SYS physical memory address. Use (print $8) to represent the 8th column of text separated by awk's default white space delimiter.
- Command #3, Use (grep) and the
output from Command #2 to search the (modscan.txt) file.
- grep `command #2` modscan.txt
-
Conclusion:
- The base address retrieved from the Blue Screen of Death was verified to be running in physical memory. RDPWD.SYS is the driver that is required for any and all RDP connections. By aggregating all the previous pieces of data (crashinfo, timeliner, pslist, netscan, modscan); we used Volatility to verify the Blue Screen information, that indeed, RDP crashed the system. It's nothing earth shattering, but it is the practice of Waxing On[1] and Waxing Off[0] to tell a coherent story.
- Instructions
| Section 9: View Console History |
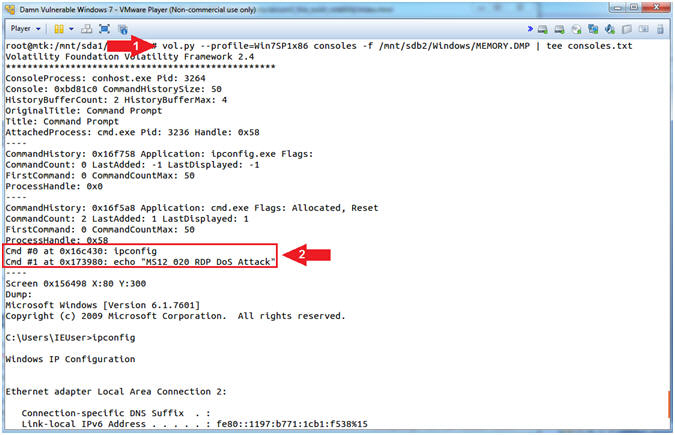
- Display Physical Memory
- Instructions
- vol.py --profile=Win7SP1x86 consoles -f /mnt/sdb2/Windows/MEMORY.DMP | tee consoles.txt
- Notice the command line history
- Note(FYI):
- Command #1, The (consoles) plugin finds commands that attackers typed into cmd.exe or executed via backdoors. However, instead of scanning for COMMAND_HISTORY, this plugin scans for CONSOLE_INFORMATION. The major advantage to this plugin is it not only prints the commands attackers typed, but it collects the entire screen buffer (input and output). Use (tee) to display the (consoles) output and write that output to a file (consoles.txt).
- Command #2, The command line history was created in the previous RDP attack lesson (Metasploit Lesson 19, Section 6, Step 3).
- Instructions
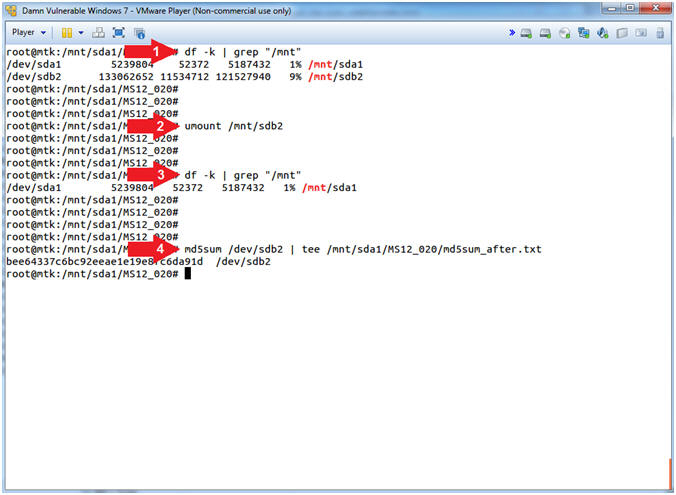
| Section 9: Un-mount Data Directory |
- Display Physical Memory
- Instructions
- df -k | grep "/mnt"
- umount /mnt/sdb2
- df -k | grep "/mnt"
- md5sum /dev/sdb2 | tee /mnt/sda1/MS12_020/md5sum_after.txt
- This will take 15 to 20 minutes.
- Note(FYI):
- Command #1-#3, Use (df -k) to display all the file systems and their corresponding directories. Use (grep "/mnt") to display only directories that contain the string (/mnt).
- Command #2, Use (umount) to un-mount the Windows 7 Data Directory (/dev/sdb2).
- Command #4: Use (md5sum) to compute and check the MD5 message digest of the Windows 7 Data Partition (/dev/sdb2) after we conduct the investigation. It is necessary to prove that the contents of the Windows 7 Data Partition (/dev/sdb2) did not change during the investigation.
- Instructions
| Section 10: Proof of Lab |
- Open a Terminal Window (On
LosBuntu)
- Instructions:
- Click on the Terminal Window
- Click on the Terminal Window
- Instructions:
- Proof of Lab
- Instructions:
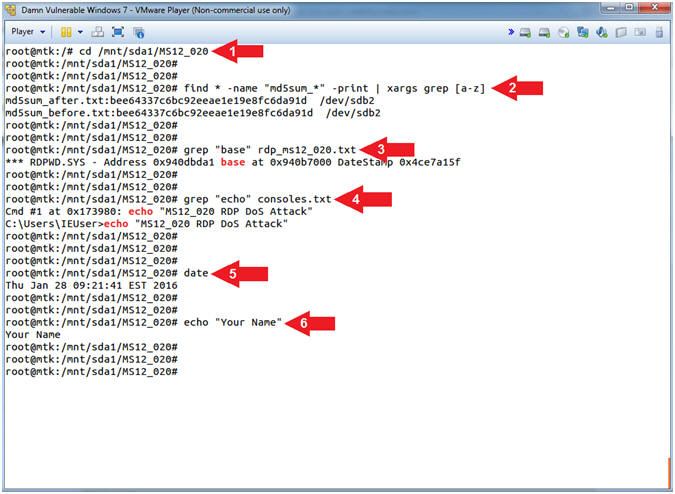
- cd /mnt/sda1/MS12_020
- find * -name "md5sum_*" -print | xargs grep [a-z]
- grep "base" rdp_ms12_020.txt
- grep "echo" consoles.txt
- date
- echo "Your Name"
- Replace the string "Your Name" with your actual name.
- e.g., echo "John Gray"
- Note(FYI):
- Command #1, Use (cd) to change directory into the (/mnt/sda1/MS12_020) directory.
- Command #2, Use (find) to display files that contain the string (md5sum_*) in its' file name. Then use (xargs) to execute (grep) to display any line that contains a lowercase letter ([a-z]).
- Command #3, Use (grep) to display any line that contains the string (base) in the (rdp_ms12_020.txt) file.
- Command #4, Use (grep) to display any line that contains the string (echo) in the (consoles.txt) file
-
Proof of Lab Instructions:
- Do a PrtScn
- Paste into a word document
- Upload to Moodle
- Instructions: